Most of what I have written so far has been about problems. Problems in the eurozone, problems in Greece and in Germany, and if I can get around to it I may write some stuff about the problems in the global economy. However I don’t want what I write to contribute to what might be called the prevailing discourse of pessimism.
Popular culture, and much of social commentary, seems addicted to the notion that things are bad and getting worse. Much of the left, and all of the greens, seem convinced that everything is going wrong, that we are in a bad way and that things cannot (and should not) go on they have been.
One of results of the prevalence of pessimism is that most people have very out of date ideas about the state of humanity and what the real conditions in the world are. Most people think things are much worse than they actually are. The problem is not so much ignorance about the real state of the world but rather an embedded culture of pessimism that makes people systematically over imagine the scale of problems and undervalue the progress that has been made.
A quiz!
Here are three questions which will be answered in the article below. Without cheating take a note of what you think the answers are and see if you have an inaccurately pessimistic view of the world. The answers are also grouped at at the end.
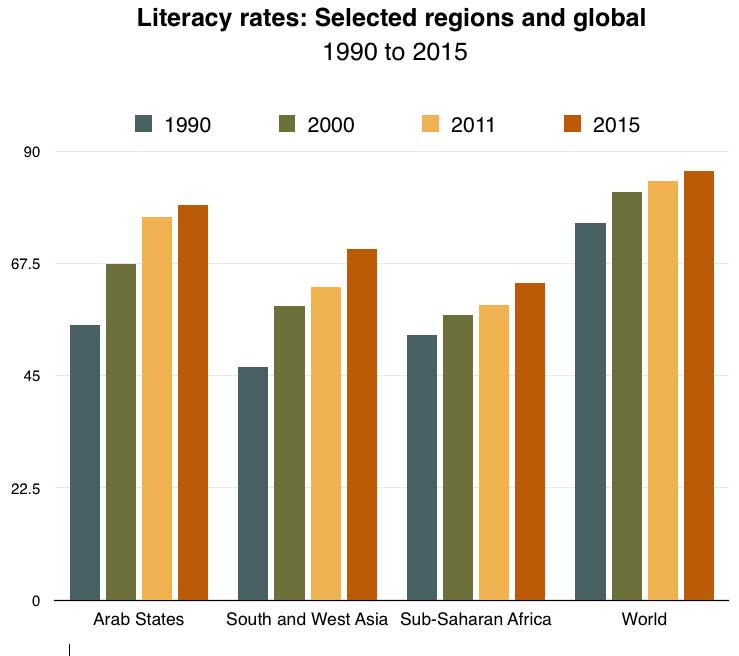
a) What percentage of the worlds population is literate?
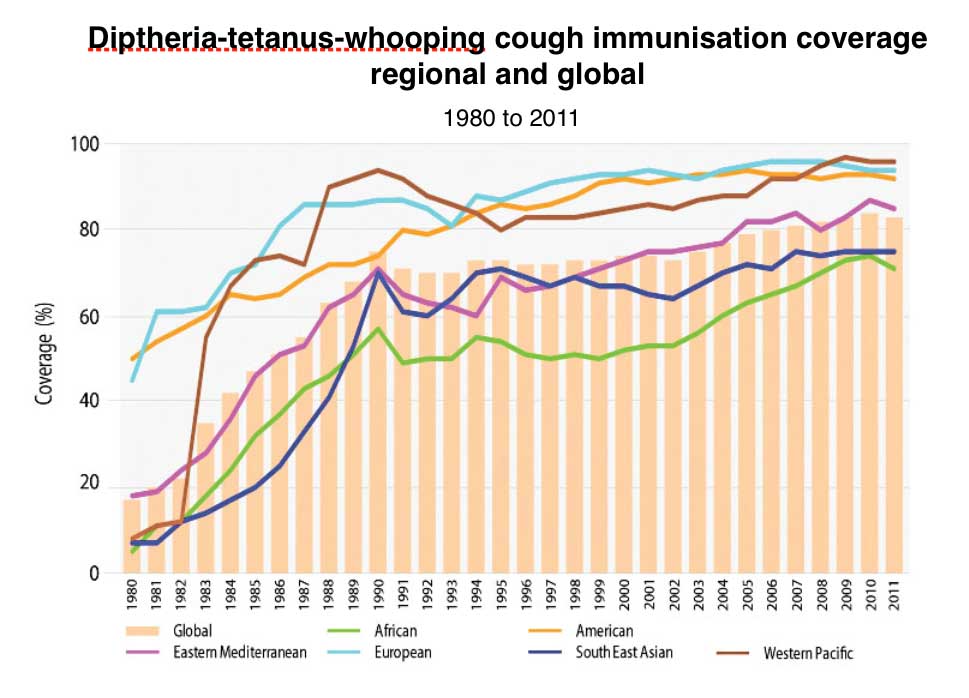
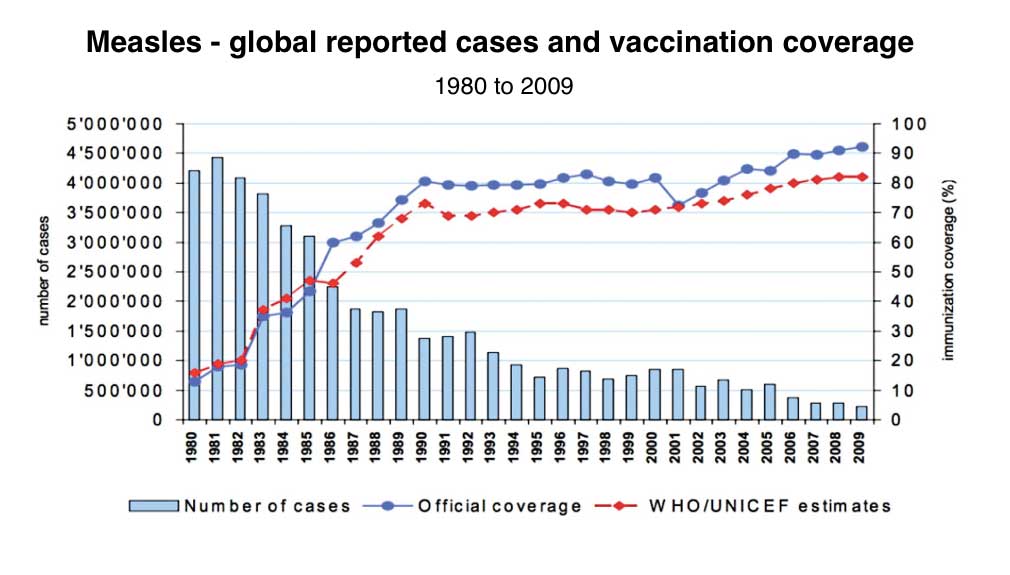
b) What percentage of the worlds population have been vaccinated against Measles, Diptheria, Tetanus and Whooping Cough?
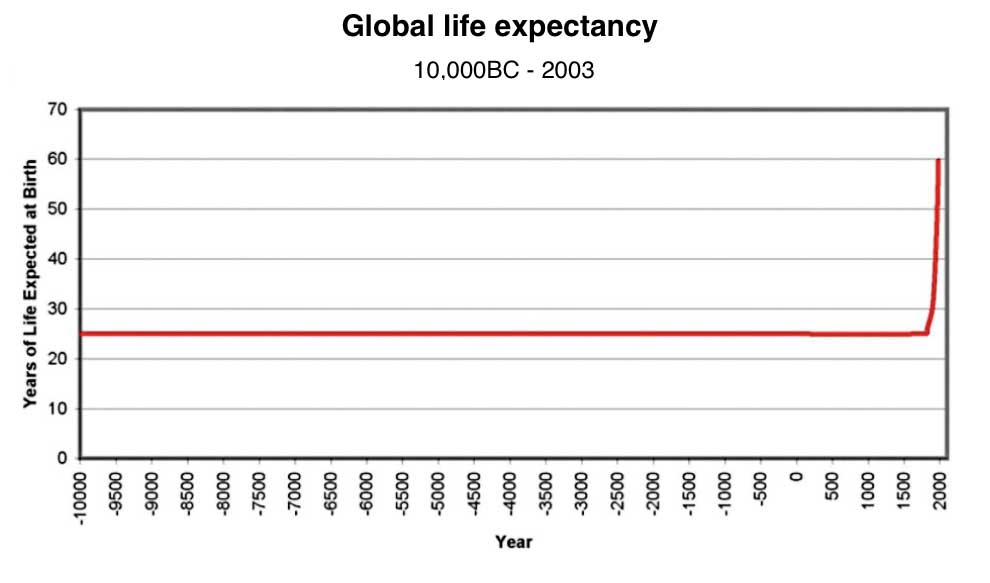
c) What is average global life expectancy?
I think the discourse of pessimism is completely wrong. Things have been getting better for a long time, and in recent decades, for most of the human race, things have been getting even better even faster. This is not an idle claim, the data to support such a view is easily available and it’s interpretation is unequivocal.
Here are some reasons to be cheerful
Let me start with the short history of economic growth. A fundamental requirement of human welfare is a certain level of material welfare. For almost its entire existence most of the human race have lived lives of acute poverty and as a result most people who have ever lived have led short rather brutish lives of poverty and suffering, working long hours for a pittance while their children often died around them and an early grave beckoned.
Then around the end of the 18th century something astonishing happened. It was called industrial capitalism. And ever since then the material wealth of the human race has grown enormously and grown consistently.
This chart show global GDP per capita (wealth per person) back to 1000BC. For thousands of years the amount of wealth per person barely increased. Then at the end of the 18th century growth suddenly begins to accelerate, averaging 1.5% per year, except for occasional very short blips mostly caused by wars economic growth continues year after year. Each generation has been around a third better off than its predecessor. Since the birth of industrial capitalism growth has driven secular rises in living standards, generation by generation.
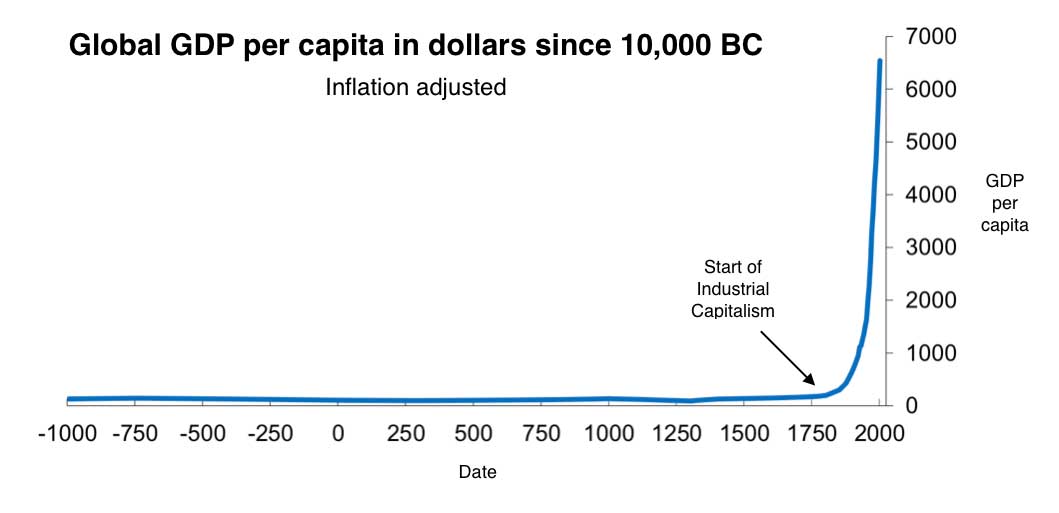
While steady, growth has not been constant. Wars, depressions and financial crises have pock-marked history, causing growth to stall or fall. And phases of innovation have lifted economic fortunes, caused living standards to leap. But whereas the growth lapses have been temporary, the leaps have been permanent. Over the past two and a half centuries, secular growth has dwarfed secular stagnation.
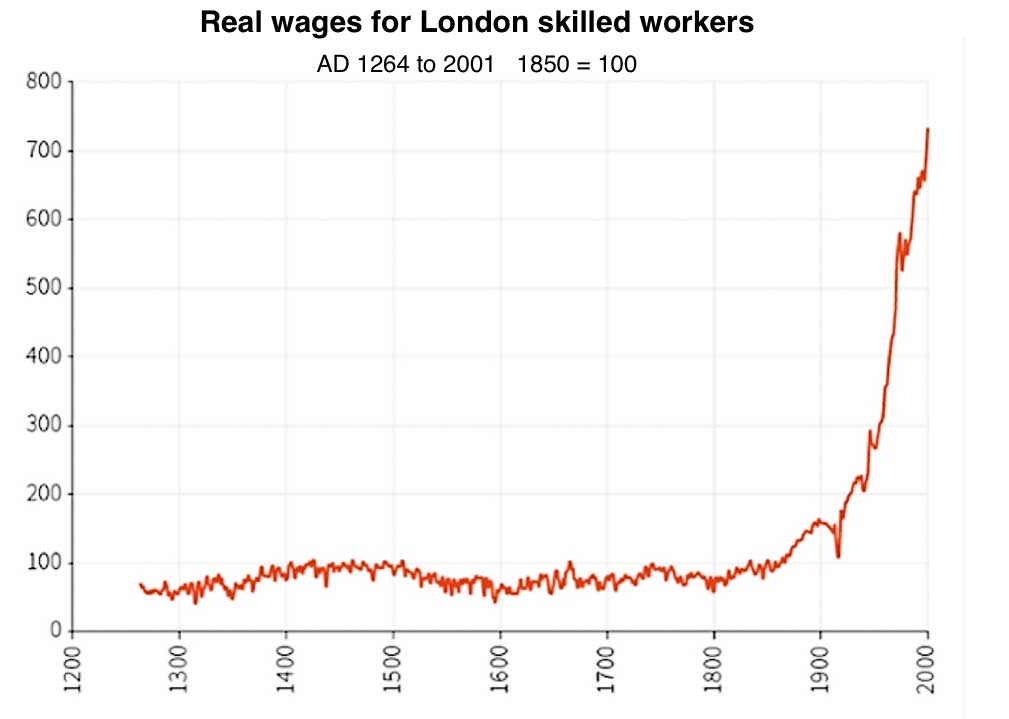
The impact of this on real incomes can be seen in this chart of the real wages of skilled workers in London since AD1264. Stagnant for centuries real wages suddenly start to go in the 19th century. Since then there have been some short periods of no growth, the 1930s and late 1970s-80s were periods of wages stagnation and if the data set of the chart was extended it would show a current period of wage stagnation since 2007, but nevertheless the trend is quite clear. Working people have been getting a lot richer for a long time.
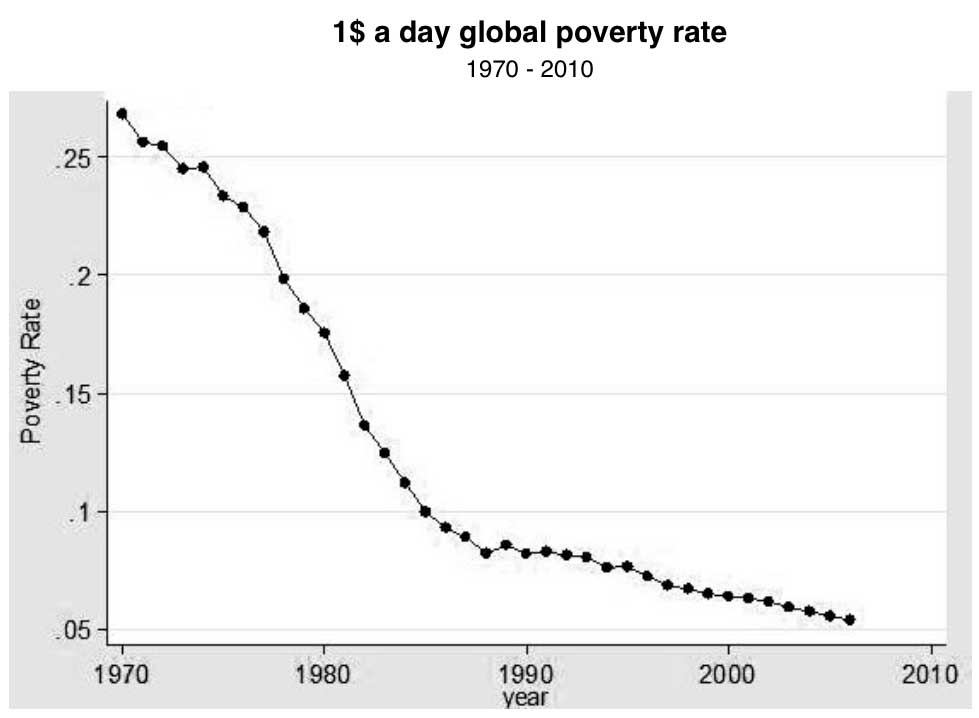
The impact of all this economic growth has been to greatly reduce the global number of people living in acute poverty. Between 1970 and 2006, the global poverty rate was cut by nearly three quarters. Although world population has increased by about 80% over this time, the number of people below the $1 a day poverty line has shrunk by nearly 64%, from 967 million in 1970 to 350 million in 2006. In the past 36 years, there has never been a moment with more than 1 billion people in poverty, and barring a catastrophe, there will never be such a moment in the future history of the world.
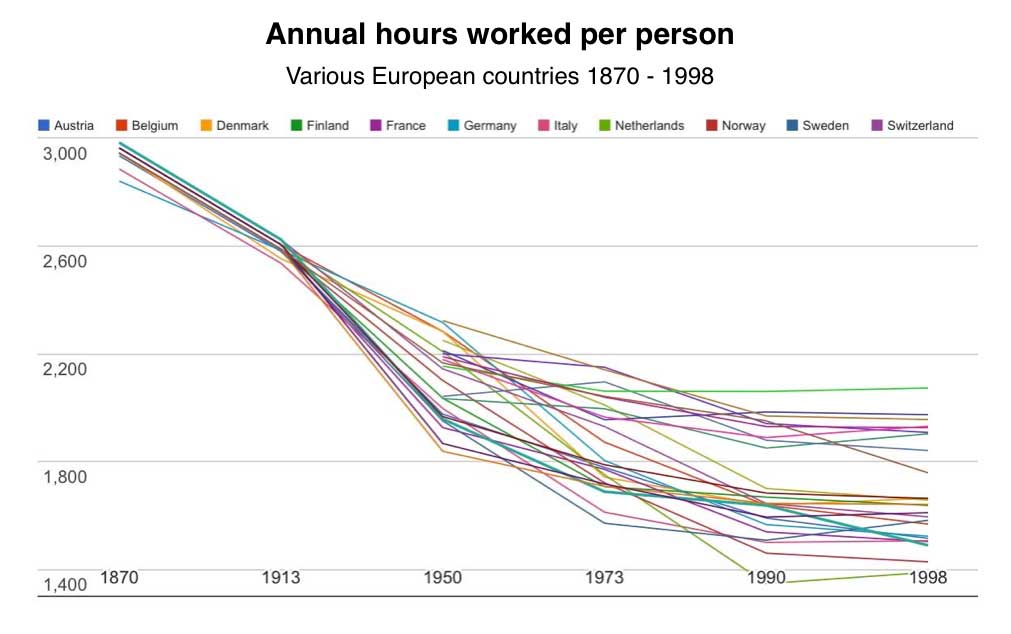
This huge increase in real incomes has been matched by an equally large reduction in the amount of time worked to earn that increased income. In this chart you can see that across Europe the average numbers of hours worked per year has dropped by almost a half over the last hundred years or so.
All this extra wealth, resulting from the spread and development of industrial capitalism, has transformed peoples lives for the better. And the improvements are continuing and accelerating.
A basic way to measure the improvements in human welfare caused by the arrival of industrial capitalism is by looking at life expectancy at birth. For almost all of human existence, for millennium after millennium, life expectancy was dismally low. Then around 1750, with the emergence and spread of industrial capitalism, average life expectancy began to rocket up and it continues to increase. Currently average global life expectancy is around 70 years and is increasing every year.
Another measure of the improvements in human welfare is the measure of the amount of energy being used per person, the more energy that is used the better off people are. As you can see from this chart global energy use has grown enormously since 1800. The vast bulk of that increase has been as the result of burning fossil fuels such as oil, gas and coal, which has replaced bio fuels like wood and fat burning. The increase in total energy use per person doesn’t capture the full progress that has been made. In the past heating my home would have involved hours of labour spent getting the wood to burn, and hours breathing the toxic smoke produced by oil lamps ands candles. Now I can access much more, and much cleaner, energy just by flicking a switch.
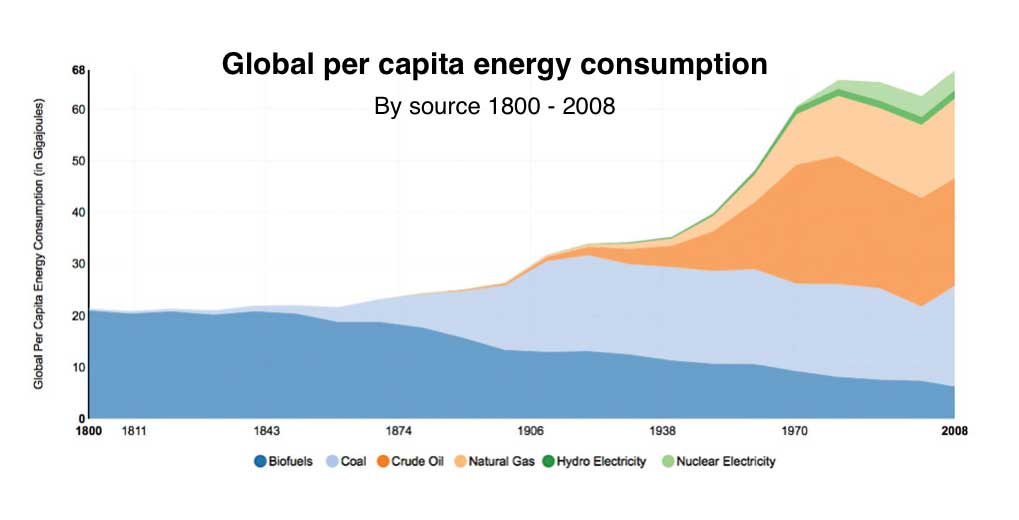
Its true to say that modernity, and modern standards of human welfare, have been built on fossil fuels. Which is why those opposed to capitalism or modernity (or both) hate fossil fuels so much, even though fossil fuels have done more to improve peoples lives than almost any other technology.
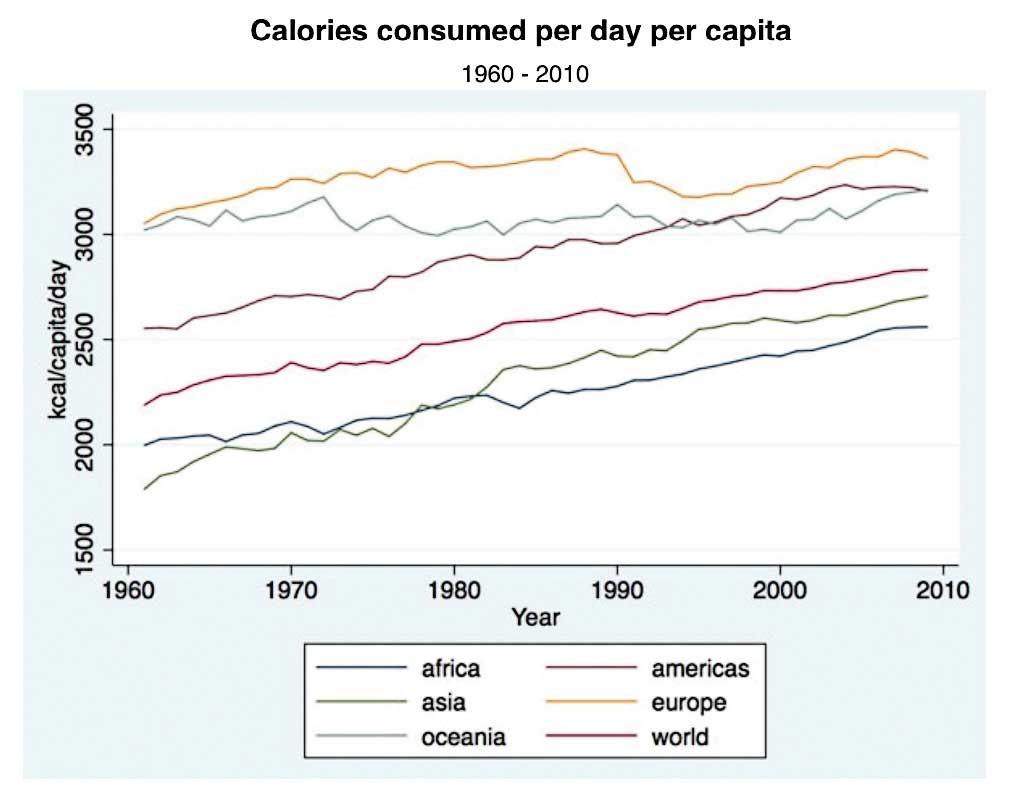
Another fundamental way to measure peoples welfare is to look at the amount of food they consume. Malnourishment was a more or less permanent feature of human existence until quite recently. The spread of industrial farming, agrarian capitalism, has vastly improved human nutrition and the improvements are continuing. This chart show the number of average calories being consumed in different regions of the world between 1960 and 2010. All regions show significant increases in food consumption and in Asia the amount of food consumed has almost doubled.
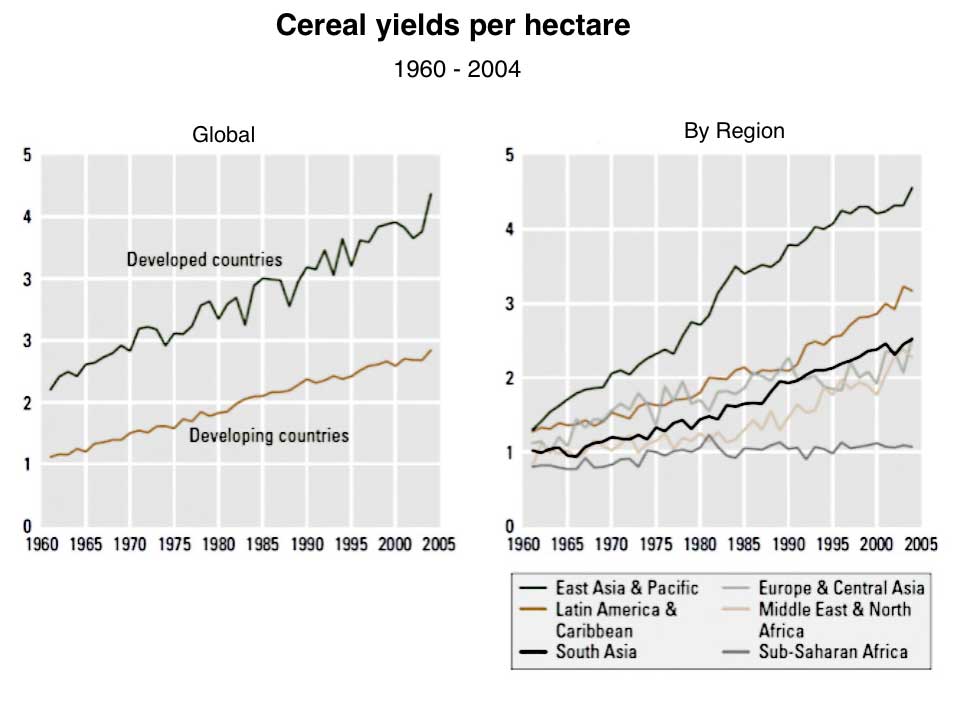
The reason there is so much food is because the amount of food produced per hectare has almost doubled in the last fifty years and continues to increase. This increase in yields has been the result of the deployment of a wide range of technologies, every single one of which has at one time or another been opposed by the green movement.
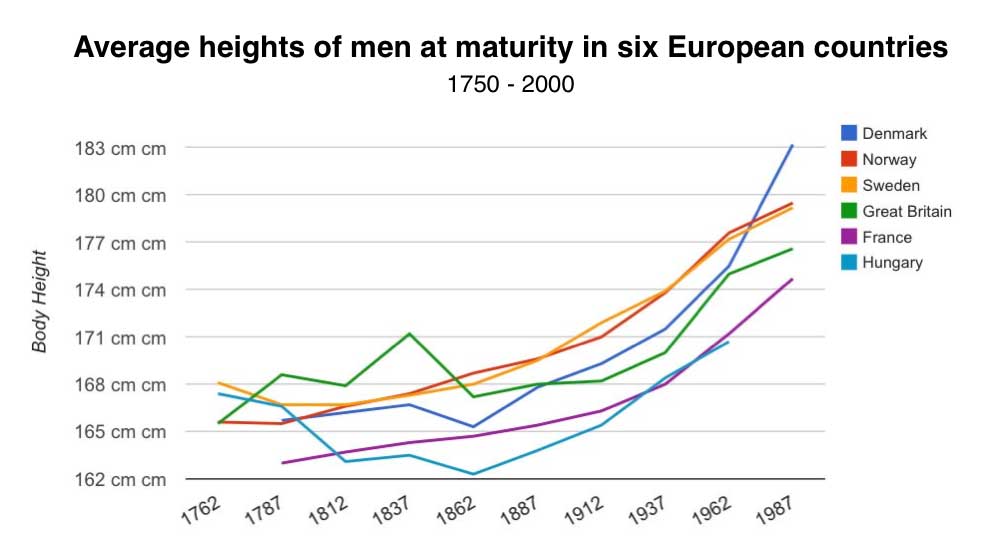
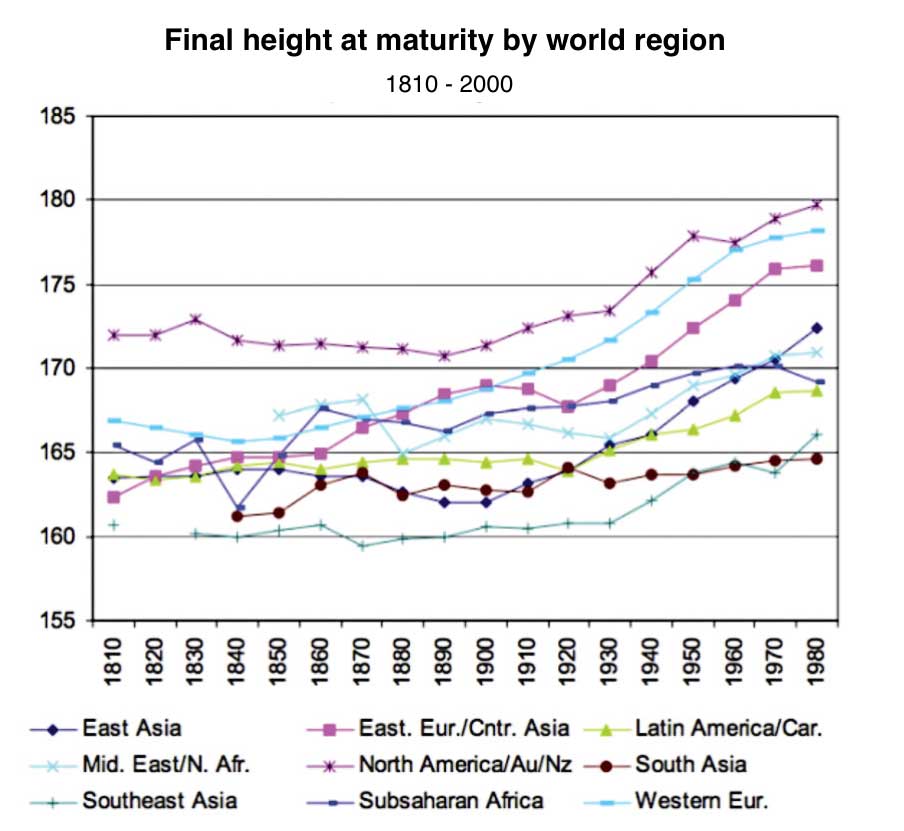
The improved nutrition is evident in the increase over the last hundred years in average human height at maturity. These two charts show height increases in Europe and globally. This increase in average height, reflecting better average nutrition, has occurred in all regions of the world.
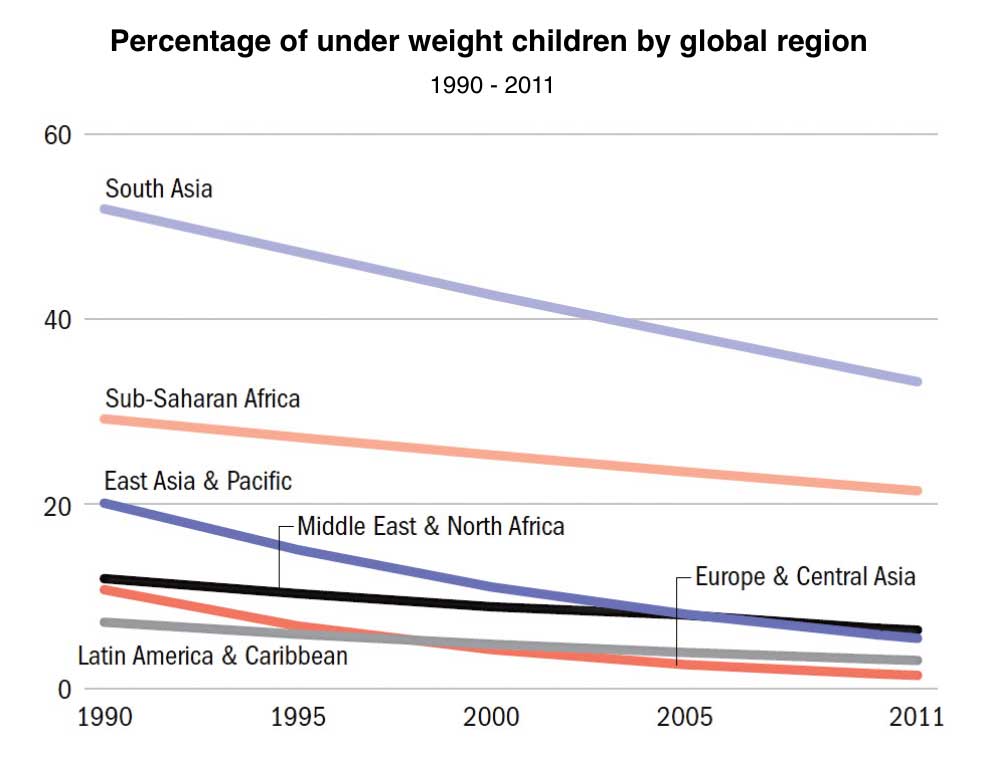
Another way to see the impact of better nutrition is by looking at the global fall in the number of children who are under weight as shown in the chart below. The fall in infant malnutrition in the last two decades has been very significant in all regions of the world and is a result of continuing improvements in affordable food supplies.
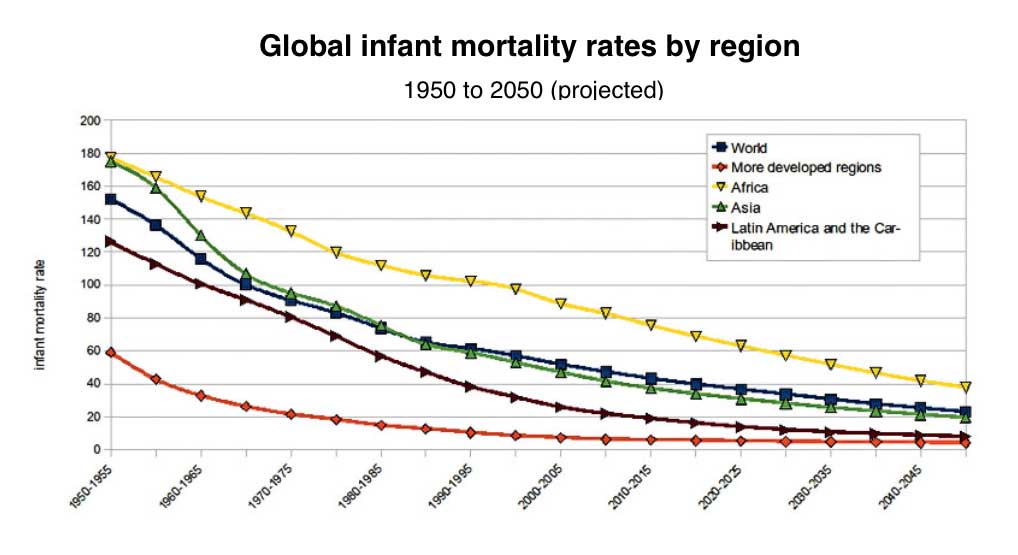
Infant mortality rates have also plummeted in recent decades and are projected to continue to fall. This chart showing the big fall in infant mortality is truly a chart of the decline of human suffering. Can there be anything worse than watching ones children die? Note the big falls in the last few decades.
Along with better nutrition for both mother and child the other big cause of the reduced child mortality is the massive increase since 1980 in the numbers of people being vaccinated against a variety of contagious diseases. The first chart below shows that the vaccination rate for Diptheria/Tetanus/Whooping Cough is now well over 80% of the global population, note how recently this massive vaccination program was implemented. The second chart shows that over 80% of the global population is now vaccinated against Measles compared to around 10% in 1980 and as a consequence the number of cases of the disease has collapsed.
Yet another important measure of human progress is the rate of literacy. If people cannot read or write they are disempowered. Literacy is an essential mechanism of liberation. The good news is that literacy rates have been growing across the globe at a startling rate, especially in the last couple of decades, and global adult literacy now stands at an astonishing 86% (its 89.5% for young people).
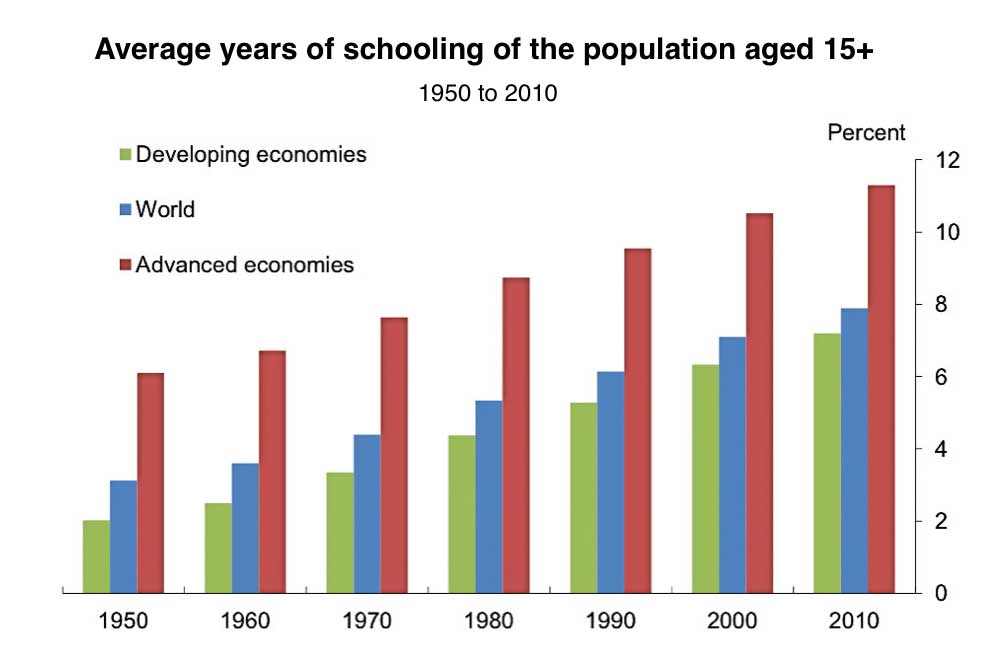
The rise in literacy is a result of the steady and continuing rise in the average years of schooling, an increase that is global and which has occurred in both developed and developing economies. The human race has become much better educated over recent decades.
The fall in infant mortality rate, the increase in literacy rates and the general increase in material well being has had a profound, and fairly recent, impact on the number of children being born per woman. This chart shows the way the fertility rate, the number of babies being born per woman, has fallen since 1950. Other than in Africa, where the fall is lagging the rest of world, the global rate is now at a replacement figure of 2.5 babies per woman.
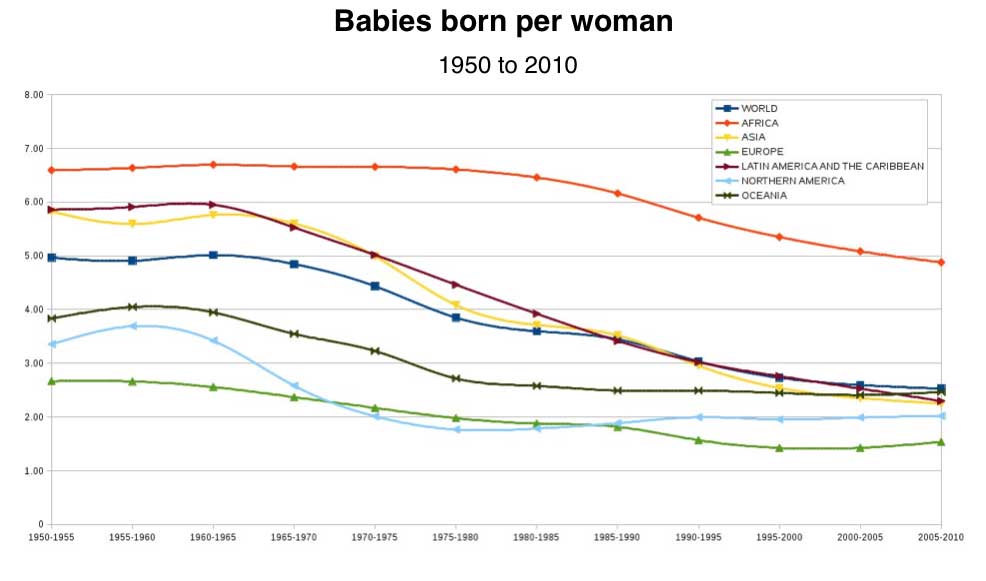
The number of children being born per woman is a crucial statistic because it determines future population growth and of course it determines the fate and life opportunities of billions of women. The really great news is that in the last decade the number of children in the world has stopped growing. This is a big milestone for our species. This doesn’t mean that population growth will stop overnight, it will take a few decades yet, but the population boom is over. To understand all this have a look at this short clip of the wonderful statistician Hans Rosling explaining on Newsnight what has happened.
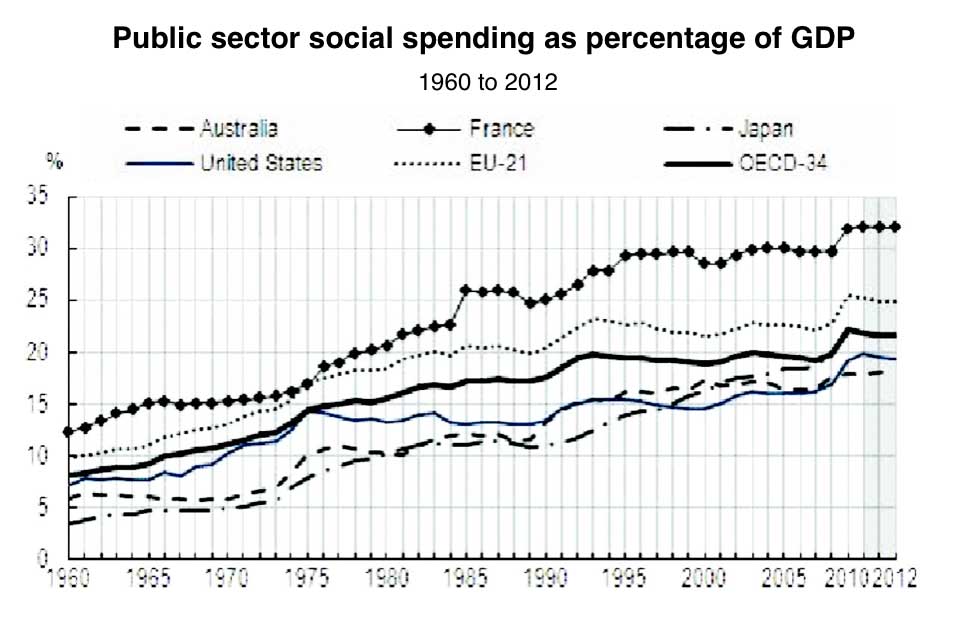
It is commonly believed that the last few decades have seen an erosion of the welfare state in the developed economies. That is not true. As the chart below shows public spending on social programs in the developed economies has risen as a percentage of GDP pretty much steadily since the 1960s, and of course this is a bigger share of a very much larger GDP so total social spending has increased significantly.
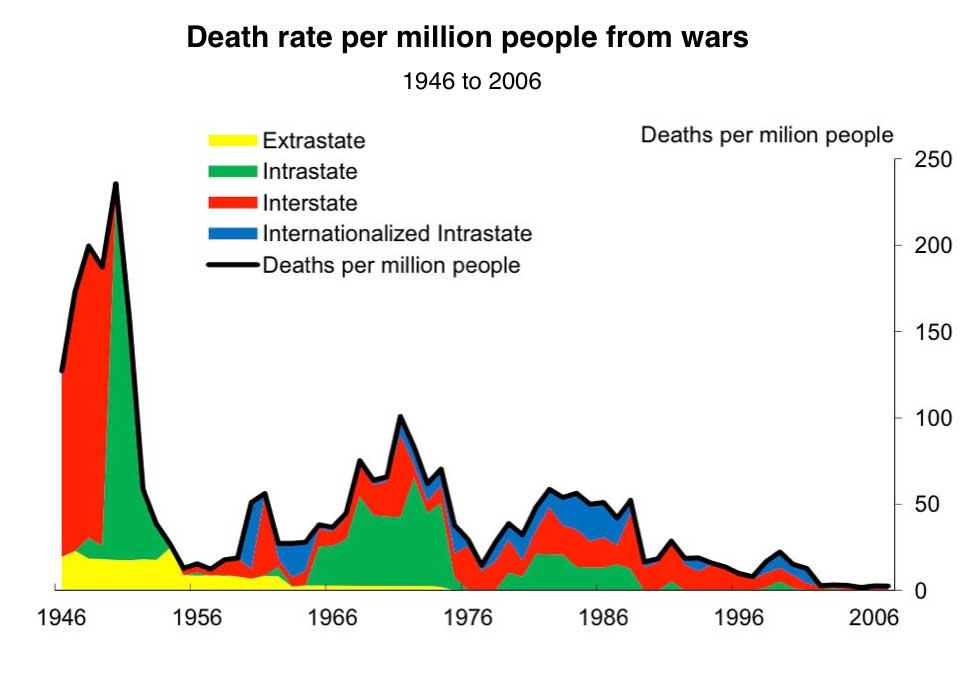
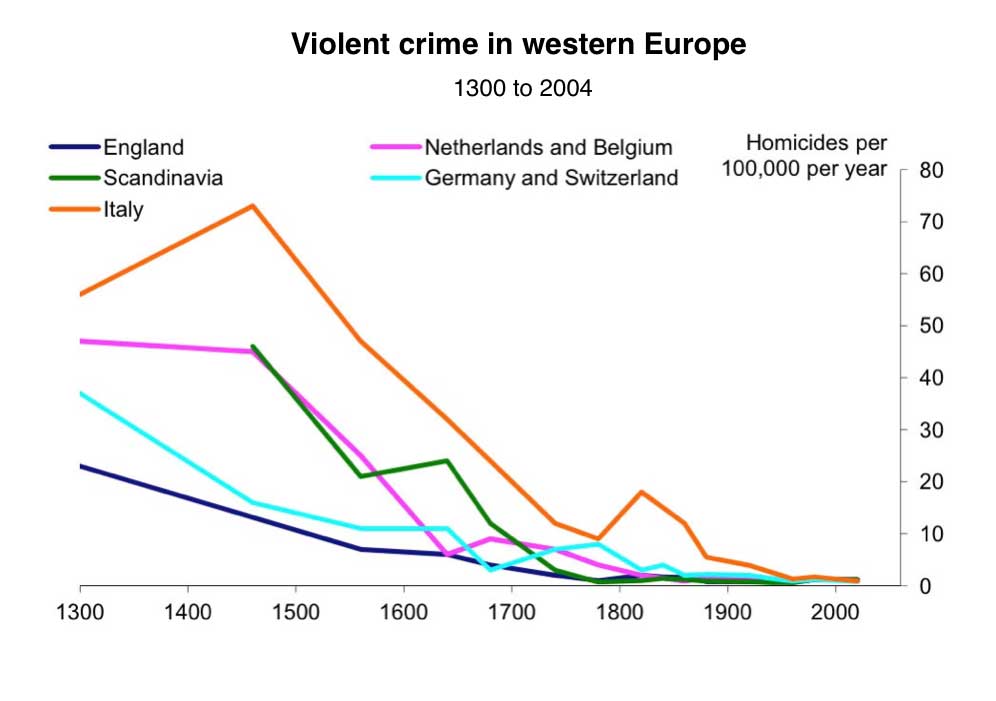
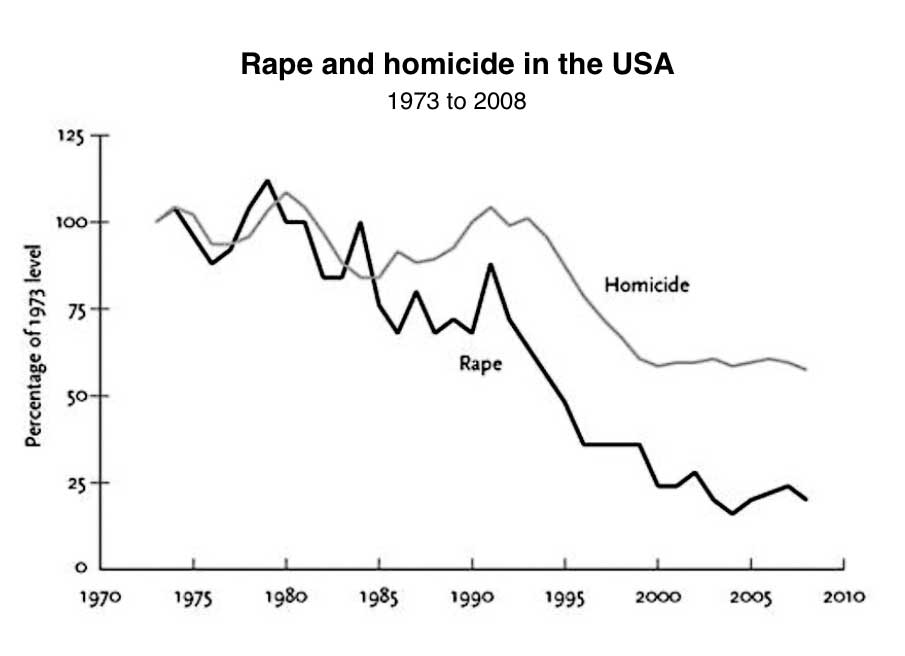
Another big part of the discourse of pessimism is the commonly held belief that the world is becoming a more violent place. That is not true. The rate of violent deaths from both war and crime has been falling for a long time and both are now at an historical low. What deaths do occur are, however, now widely reported, photographed and filmed a lot more than they were in the past, creating an image of a more violent world. The first chart below shows how the death rate from wars has collapsed to a very low level. The second and third charts show how violent crime has declined very significantly in both Europe and the USA.
Those opposed to modernity, and those addicted to pessimism, often claim that the progress that has been made, and the economic growth that fuels it, cannot continue because it will destroy the planet/nature/the environment. I think that there is no evidence to support that proposition. There are localised, and sometimes acute, environmental problems but there is no generalised existential environmental crises. Those countries experiencing rapid economic development and urbanisation often have messy environmental problems associated with the early stages of development, but such problems are transitional and will be resolved. The countries that have already achieved high levels of economic development, as well as democratic political systems and rich civil societies, all have seen vast improvements in their environments compared to the early stage of their industrialisation. The topic of the general state of the global environment is too big for this article but here are a couple of stats and graphs to illustrate some positive trends in the environmental.
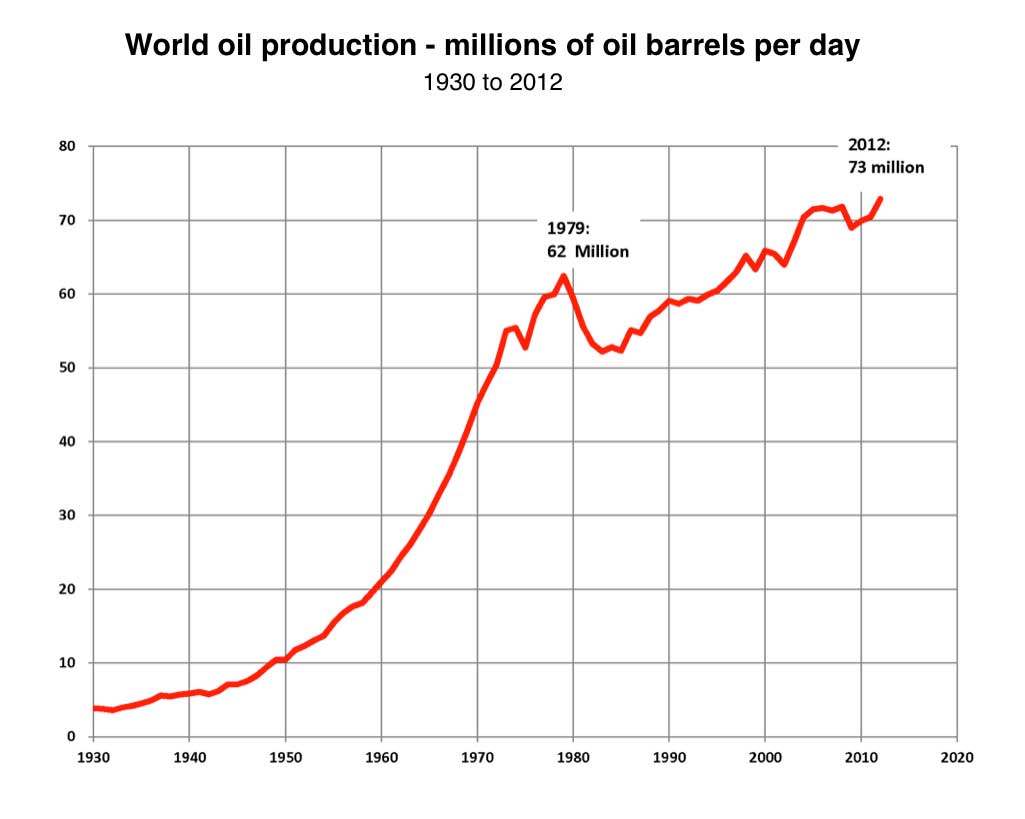
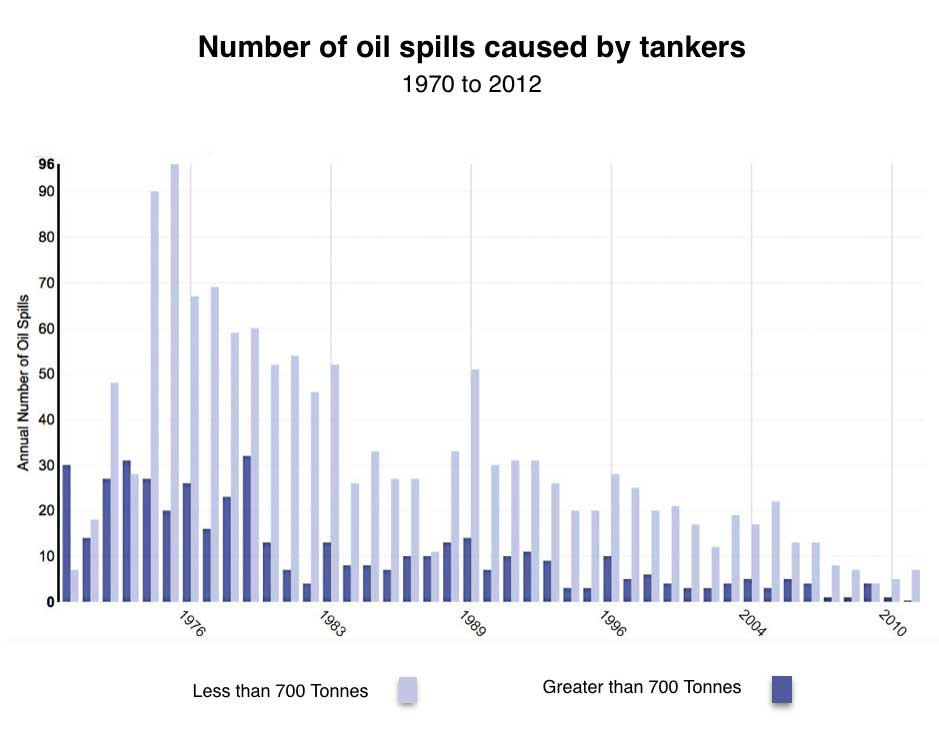
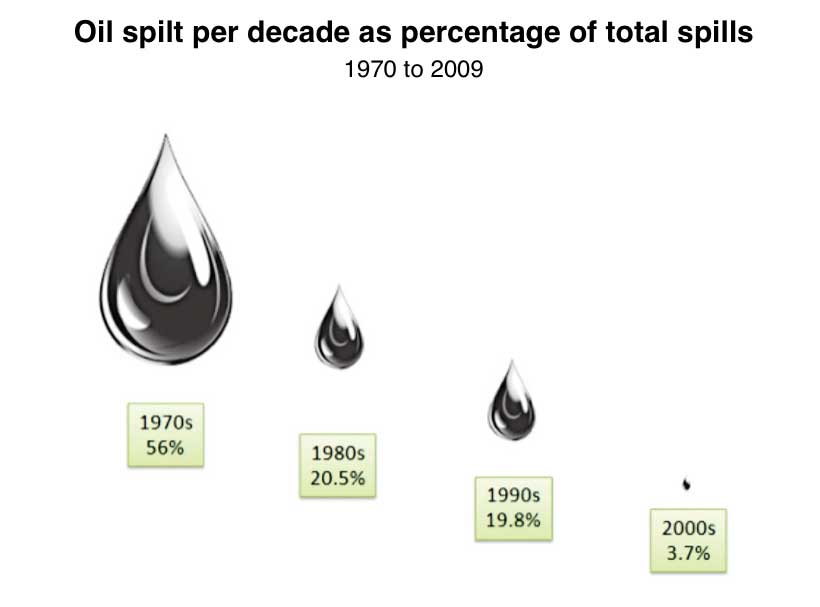
Even though oil production has grown rapidly in the last few decades the amount being spilled in accidents has reduced by a huge amount. Oil spills are now very rare.
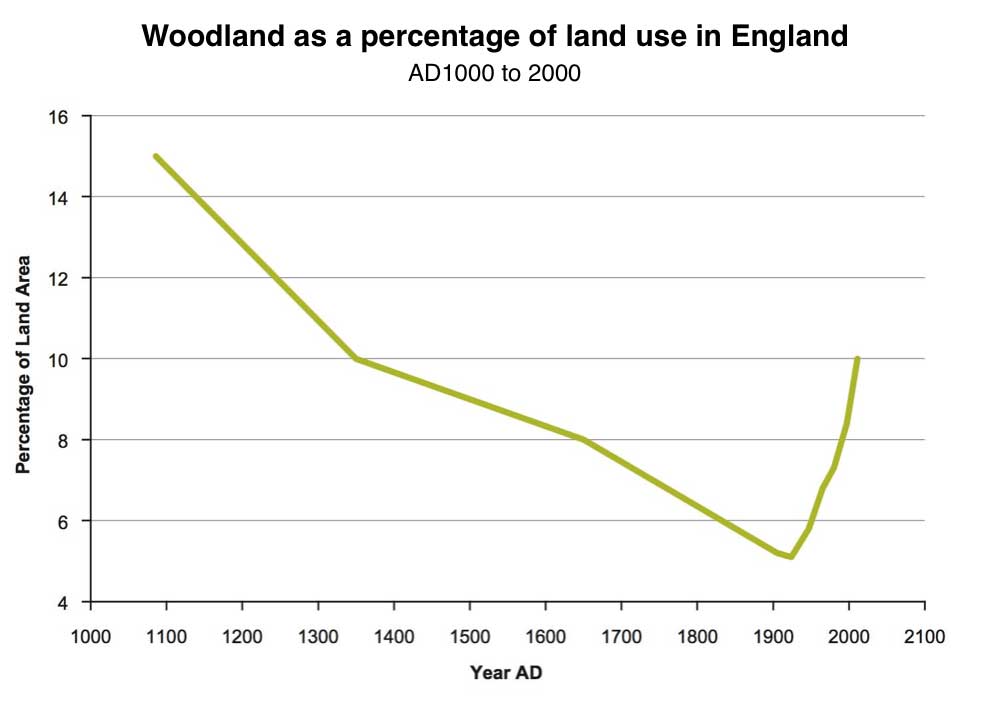
The Worlds forests are doing quite well. Loss of forests is mostly associated with the early stages of economic development and forests coverage often improves once societies are urbanised and industrialised. The first chart below shows the amazing recovery of forests in England in the 20th century. By the year 2000 English forests had recovered to an extent last seen in the 14th century.
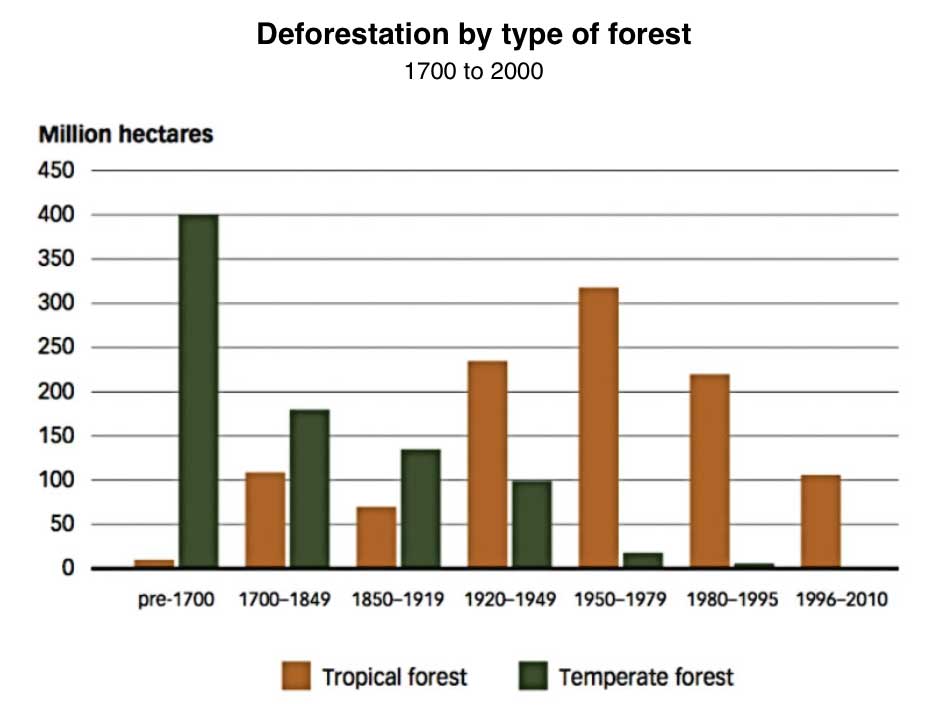
A big factor in deforestation is the use of wood for heating and cooking, switching to modern fossil fuel based energy sources is strongly associated with the ending of deforestation and the recovery of forests. As the second chart below shows loss of global temperate forest has come to an end and the loss of tropical forests is declining rapidly.
What I have offered in this article is just a sample of data to try to show that a pessimistic view of the world is unjustified. There is a lot more data out there and much of it makes for cheerful reading. Here are some data sources if you want to have a look for yourself.
The economist Max Roser from University of Oxford has done a lot of work in this area, he maintains the Our World in Data web site as well as a blog about statistics of progress. Both are worth a look, his work was the source of a lot of the data in this article.
If you want to find out about the real state of the world you should definitely check out the work of Hans Rosling, a man who can truly make statistics exciting. Visit his Gapminder web site for lots of animated data and have a look at his wonderful video lectures, below are some examples of his lectures and there are lots more on YouTube.
Hans Rosling: 200 Countries, 200 Years, 4 Minutes
Hans Rosling: How not to be ignorant about the world
Hans Rosling: The Overpopulation Myth
Hans Rosling: Facts and Fiction on Global Health
Hans Rosling: The magic washing machine
a) 86% of the worlds population is literate.
b) Over 80% of the worlds population has been vaccinated against Measles, Diptheria, Tetanus and Whooping Cough.
c) Average global life expectancy is 70 years and rising.

Nice post. No matter what happens on shorter timescales and in localised areas, the background trend is certainly towards a healthier, better educated, richer and more peaceful global population. People need to bear that in mind more often!
A few points:
Re environment and energy: The elephant in your room is climate change. One of the great questions for this century will be: how do we reduce fossil fuel usage without compromising development? I fail to see why this can’t be achieved, as long as green opposition to nuclear and cleaner gas sources is overcome, and as long as new tech (IMO esp solar and storage) continues to improve. It seems a bit odd where you claim that people “hate fossil fuels” – who does beyond the Greenpeace fringe? The scientific community acknowledges that we need to replace fossil fuel use – which is hardly the same as hating them (or capitalism, or modernity).
Re increases in welfare spending – Is that inherently good? It could perhaps be said that spending is rising not because states are becoming more generous, but because the need for welfare is increasing. The bulk of that likely comes from increasingly top-heavy demographics (how much, I don’t know, it would be interesting to see those welfare figures broken down a bit). We should obviously be aiming to improve life expectancy, but hopefully over time, the elderly cohort will become more healthy and more productive, and so not require such extensive assistance. Thus, welfare spending might decrease, and in that instance it would be good.
PS, great running analysis of eurozone issues too!
Glad you liked the article and the blog. I will be posting something about climate change as soon as I can write up my notes. In nutshell I do not think that the evidence of the last 25 years, which has seen a large proportion of CO2 added to the atmosphere but a hardly measurable increase in temperature, supports the thesis of a accelerating or dangerous climate change. I think any warming will get in the next century will be fairly mild (I would be surprised if it is over one degree) and easily coped with in a richer world. Only poor people suffer from weather and climate related problems, rich people can adapt and shrug them off. The important things is continue rapid economic development in the emerging economies and that means burning lots more fossil fuels. Personally I think, and hope, we will burn most of the fossil fuels in the next century and build a vastly richer world in the process.
Comments on this entry are closed.