
The great financial crisis of 2008 had many causes, and a very important one was the great imbalances in global trade that had developed over the preceding years. Those imbalances have not been significantly reduced and in some case they have grown worse. The result is that debt levels are rising and in some cases are beginning to approach the levels seen just before the crash of 2008.
In previous articles (see here, and here, and here) I have explained that when large scale and persistent trade imbalances occur they also generate large scale capital flows. Countries that run persistent trade deficits are by definition consuming more than they are producing, and therefore they will need to borrow the money to pay for their excess consumption. Similarly countries that consistently run large and persistent trade surpluses will have excess income that is not being spent (consumed or invested) domestically and so surplus countries will have to export that income in order to generate a return on it. Remember also that all trade surpluses are matched by equal trade deficits somewhere else. The upshot of this is that trade imbalances always generate equally large capital flows that move in the opposite direction. Goods flow into deficit countries along with incoming capital flows to pay for them, and excess goods flow out of surplus countries along with capital outflows flows seeking borrowers.
By definition the capital flowing into the deficit country is creating new debt, it is after all being borrowed. And if the trade deficit persists and is large then it will inevitably lead to a growth in debt inside the deficit country. If the incoming capital is paying for productive investment in the deficit country then that debt my be sustainable because it will lead to enhanced productivity in the deficit country, a growth in the economy and eventually that debt can be paid down. Another important advantage of debt generated by productive investment is that the associated loans tends to be committed for a long time which means if there is a credit shock it is harder to withdraw the credit abruptly.
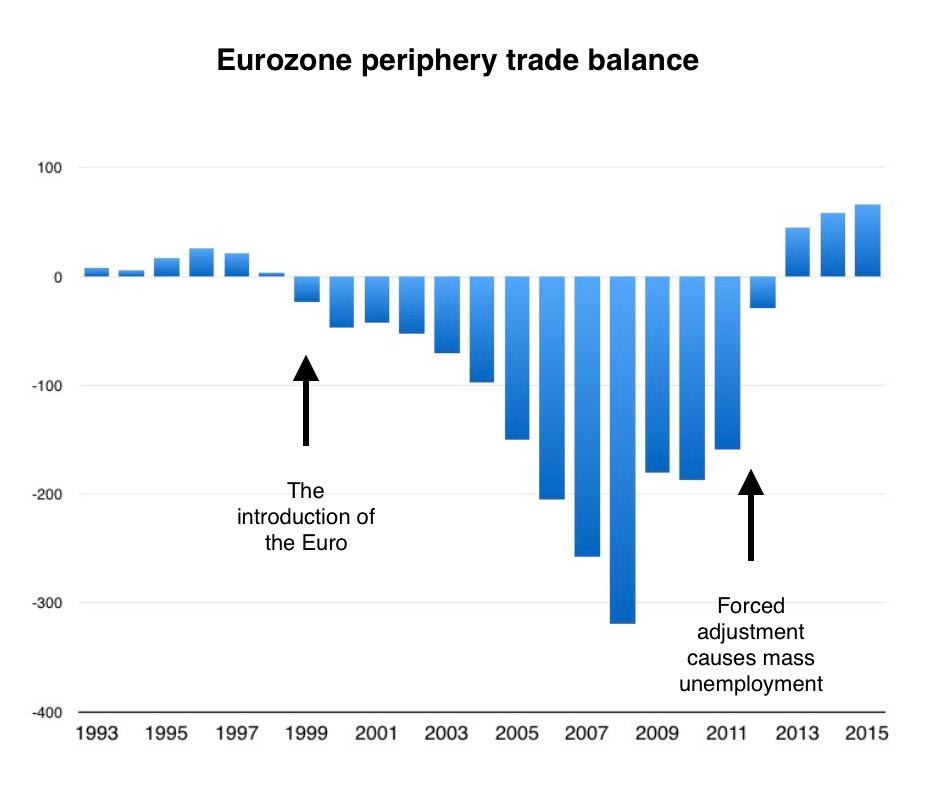
Unfortunately the build up of deficit driven debt can however become a serious problem if the incoming capital is being borrowed not to pay for productive investment but is instead being used to pay for private consumption (even if that private consumption is being financed via government borrowing, for example by keeping taxes low and running a government defict). A persistent and large flow of cheap credit into a country can quite easily create asset bubbles, particularly property bubbles. This is what happened in the periphery of the eurozone prior to 2008 when huge capital flows from the giant German surplus flowed in the eurozone peripheral countries like Spain and Ireland and fuelled huge property bubbles. When those bubbles popped (as all bubbles will do at some point) property prices plummeted, asset values collapsed and much of the accumulated debt became bad debt threatening the financial integrity of a lot of big and systemically important banks.
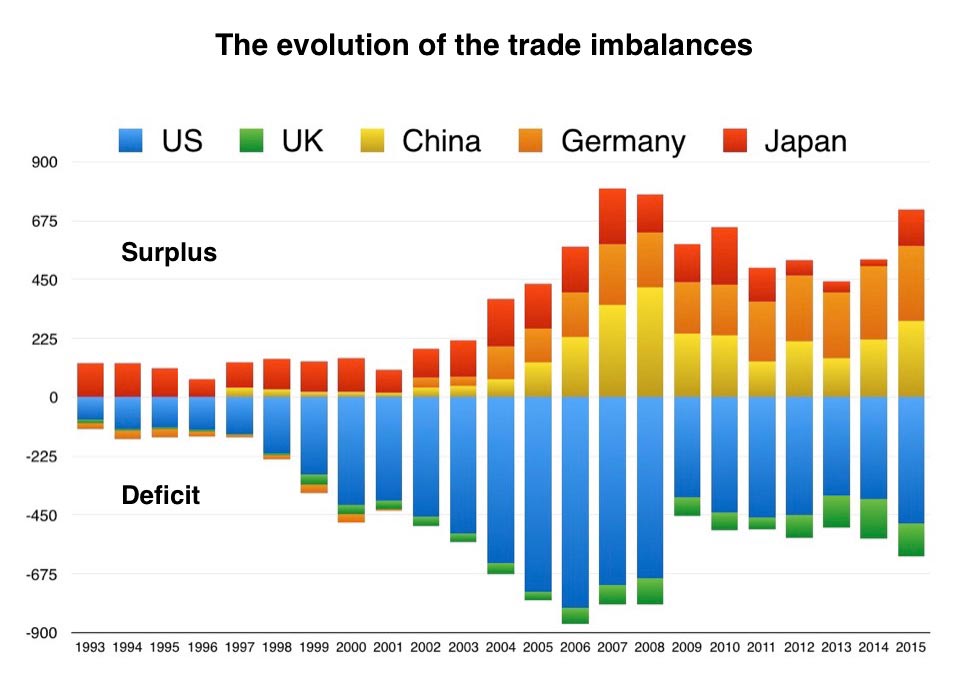
Here is a table showing the top ten surplus and deficit countries in the world, and a graph showing the evolution of the biggest surpluses and deficits over the last twenty plus years. Note that the figures in the table are from 2015, since then the German surplus has grown and is now bigger than China’s surplus. The most striking thing about these figures is just how huge the global imbalance is, over a trillion dollars for just these countries. This is not very healthy, nor does it make the global economic system more stable, quite the reverse. The graph shows how the imbalances ballooned as the 20th century came to a close, grew rapidly until the financial crisis of 2008, shrank a bit during the resulting recession, and are now growing once again.
Top ten surplus and defict countries | |||
|---|---|---|---|
| Surplus in Billions of $ per year | Deficit in Billions of $ per year | ||
| China | 293 | United States | -484 |
| Germany | 285 | United Kingdom | -123 |
| Japan | 137 | Brazil | -59 |
| Korea | 106 | Australia | -56 |
| Netherlands | 81 | Canada | -51 |
| Taiwan | 76 | Saudi Arabia | -41 |
| Switzerland | 76 | Mexico | -32 |
| Russia | 66 | Turkey | -32 |
| Singapore | 58 | Algeria | -27 |
| Italy | 39 | India | -26 |
A few observations about these imbalances
The US and the UK
US and UK are the big consumers of last resort for the global economy, exporting their demand to the surplus countries (remember that surplus countries, by definition, are under consuming, and need demand from abroad in order to sell all their goods). It is not a coincidence that it is the US and the Uk that run the largest deficits because they are home to the two largest global financial centres, New York and London, and thus not only have the financial apparatus to handle the large capital flows that are financing the deficit but also routinely attract large non-trade related capital inflows that finance their deficits. The problem for both the US and the UK is that inflowing capital and the trade deficit pushes down the domestic saving rates and floods their financial system with cheap credit. This produces apparently impressive GDP growth in both cases but is also leading to a big build up of private debt.
Last week, the New York Federal Reserve revealed that US consumer debt balances have risen again, touching $12.73 trillion at the end of the first quarter of this year, above the 2008 peak of $12.68 trillion. If you look at the issue central to the last crisis — mortgage debt — things seem ok: only 3.5 per cent of home loans went into arrears in the first quarter, compared to 10 per cent a decade ago. But it is now student debt that seems to be playing the role that sub-primes played in detonating the last credit cycle crisis. US Student debt has exploded in recent years to unsustainable levels, and “serious delinquency” rates are already 10 per cent, shattering the confidence and spending power of one segment of the population. If interest rates rise, or growth slows down, these problems could spiral. US Corporate leverage is also very large by historical standards. This has not grabbed many headlines this decade, partly because it did not play a role in the last crisis. But in recent years companies have been stealthily loading up on debt. The Securities Industry and Financial Markets Association, for example, says that corporate leverage is $8.52 trillion, or 57 per cent above the last 2008 peak, with a particularly dramatic increase in risky borrowing in the last year.
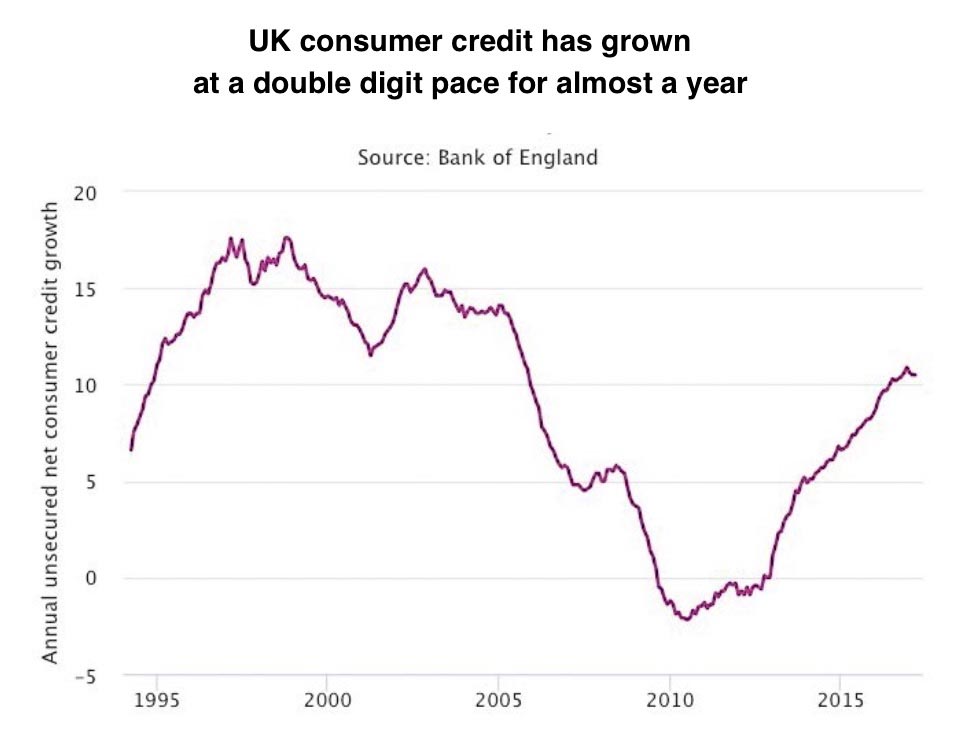
Personal debt in the UK is also rising sharply. UK credit card debt rose to a fresh record of £67.3 billion in February, while the annual pace of growth climbed to 9.3% – the fastest pace since February 2006. Meanwhile British households ran down their savings to a record low at the end of 2016, raising fears that the UK is on course for a fresh consumer debt crisis. The saving ratio – which estimates the amount of money households have available to save as a percentage of their total disposable income – fell sharply in the fourth quarter last year to 3.3% from 5.3% in the third. It was the lowest since records began in 1963.
It is also worth noting that the UK plays the role of consumer of last resort for a sizable chunk of the eurozone. The UK exports its own demand into the eurozone where it replaces the missing demand caused by eurozone deflationary policy pressures. If the UK were to be cut off from the EU post Brexit by any significant trade barriers then the eurozone would be losing an important market for its goods and would as a result suffer further deflationary pressures.
Canada – a deficit debt zombie
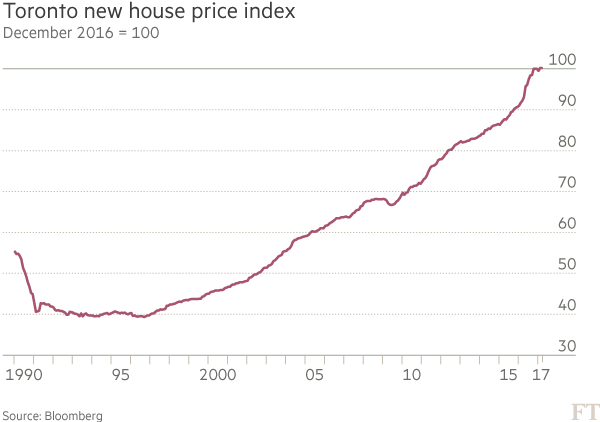
Other countries are also building up significant debt burdens. In Australia and Canada very big property bubbles have inflated. The Canadian bubble may be on the edge of popping. It has already outgrown the US property bubble that caused the 2008 sub-prime crash (see the charts below) and the property sector in Canada is already showing signs of distress. Home Capital Group, Canada’s biggest “alternative” mortgage lender is in trouble, its shares recently collapsed by 65%. It is not a bank so it has to obtain its capital by attracting deposits and borrowing money through other channels. it’s experiencing a run on its deposits. Teetering on the edge of insolvency, it obtained a $2 billion bailout loan at the end of April and as part of that process it had to have its assets valued. Its assets are its mortgages and these were only valued at 50 cents on the dollar indicating gross over valuation in the property market.
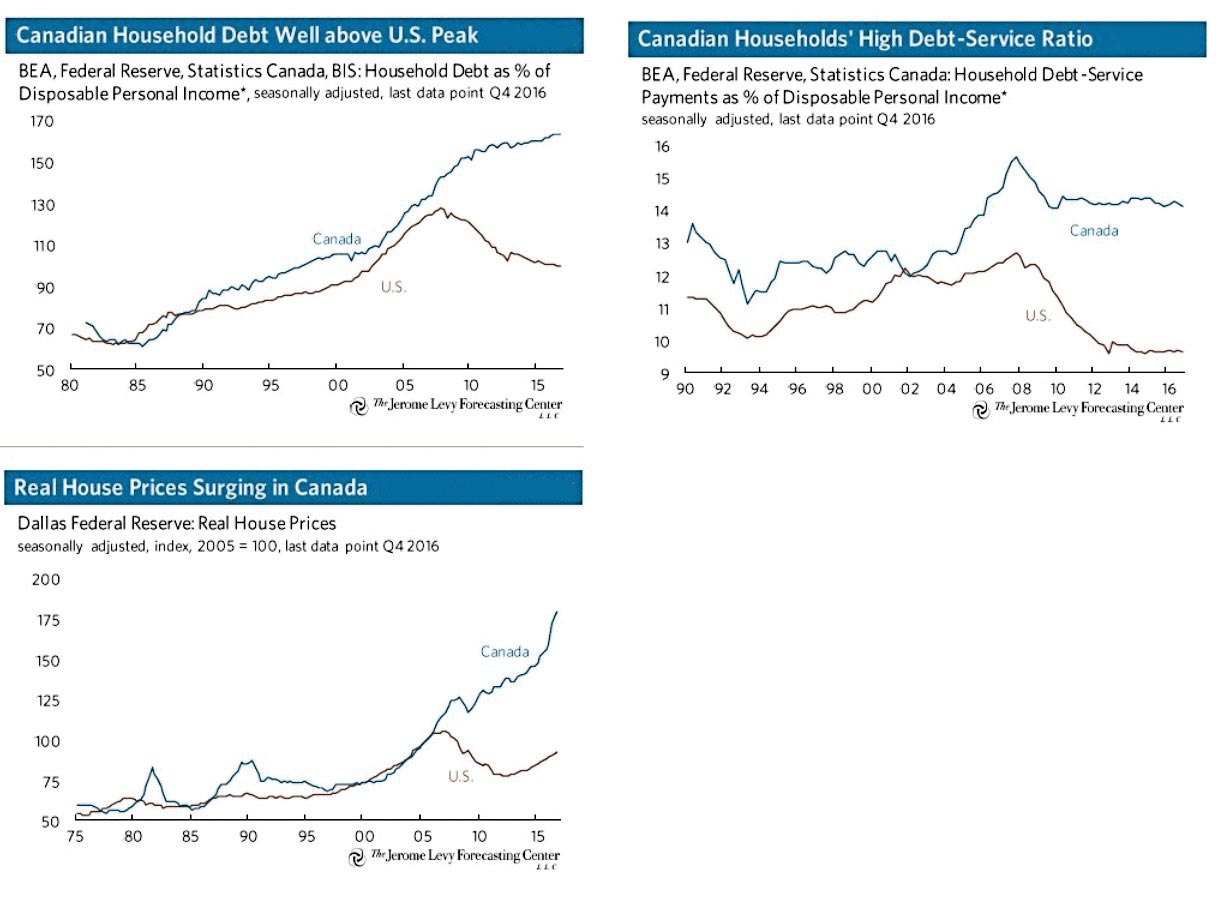
In March the Bank for International Settlements (the central bank of central banks), or BIS, updated a series of numbers it considers indicative of financial stress. The BIS tracks four “early warning” indicators of stress in domestic banking systems, and Canada was the only country that triggered red lights in three of the four. Private credit in Canada is 17.4% larger than economic output, second only to China, where debt is 26.3% greater than gross domestic product. (The BIS starts to worry when the credit-to-GDP gap exceeds 10%.) Canada’s property prices are 11.6% greater than what the BIS calculates as trend, one of the widest gaps in the world.
The eurozone’s one sided adjustment
In a recent article criticising Jeroen Dijsselbloem head of the euro area’s finance ministers I wrote about how the adjustment of trade imbalances in the eurozone was being forced upon the deficit countries, at great social cost, and that the surplus countries (whose policies actually drove the imbalances) had escaped adjustment. In that article I used the term ‘Northland’ to stand for the surplus countries of the eurozone such as Germany and the Netherlands, and ‘Southland’ to represent the deficit countries of the eurozone periphery and I said this:
“Northland and Southland have imbalanced trade, Northland is running a trade surplus and Southland a trade deficit. If all the onus for fixing this is placed on Southland then the only way it can be done is to suppress the internal demand for imports, and the only way to do this is to hold down internal demand and turn off the flow of cheap credit. The result of taking this approach would be a shrinkage of the Southland economy and rising unemployment, bankruptcies and poverty. This is what has happened across the eurozone periphery in places like Spain, Ireland, Portugal, Italy and Greece. This is hardly a progressive policy.”
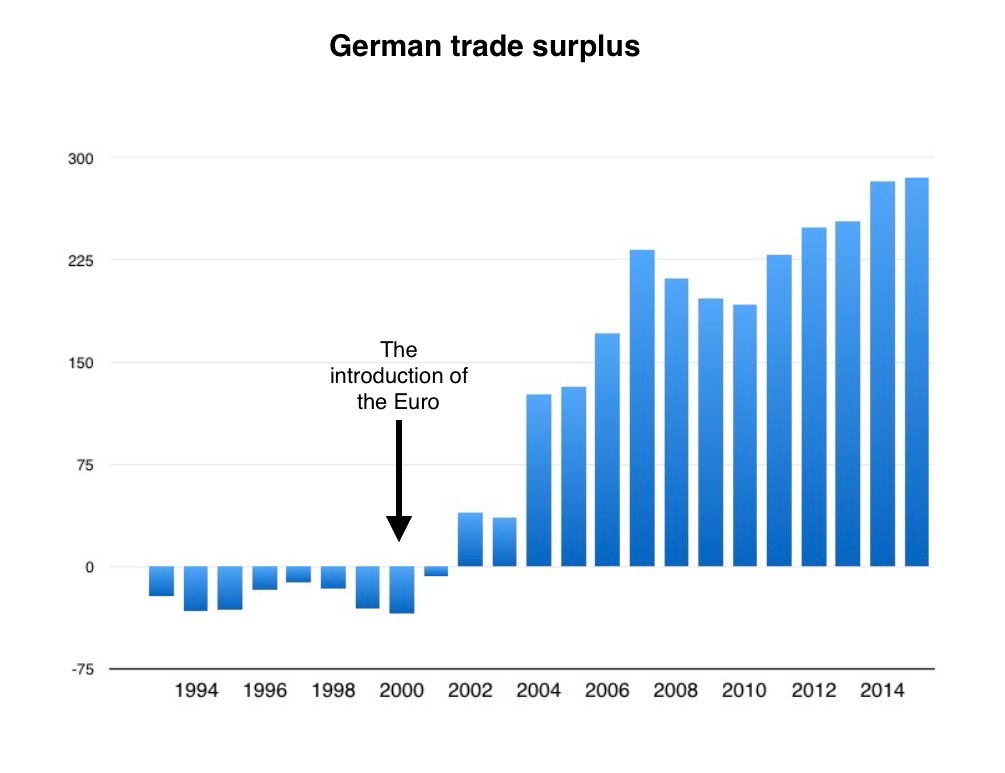
The two charts below show how this happened. The first chart show how once the single currency was operational a huge deficit developed in the periphery, and once the crisis struck in 2008 the trade deficits were systematically reduced causing economic contraction and mass unemployment. The second chart shows that Germany has not adjusted its policies at all and continues to run an irresponsibly large (in fact huge) trade surplus.
The most bizarre member of the top ten surplus countries is Italy, a country that has not grown at all for the 17 years since the eurozone was created and which is suffering an unemployment rate approaching 12%, but which, driven by the ruling eurozone policy dogma, can still generate a trade surplus.
The Walking Dead of Debt
In this lecture from May 2016 the economist Steve Keen, and proponent of the Minksy financial instability hypothesis, explores the shortcomings of how credit and debt is analysed in modern economics. In the final section of his lecture he uses the analytical tools he has developed to list the countries likely to suffer a major debt adjustment followed by a prolonged period of low growth.
The lecture is quite long and the middle section is pretty technical. The first section is a first rate critique of the failure of mainstream economics to understand credit and debt creation.
Its really worth watching from the 13.29 point in the video as Keen explains how to analyse debt and credit patterns in real economies in order to predict debt problems by using what he calls ‘the smoking gun of credit’.
At 21.50 in the video Keen begins to list those countries which will likely face a debt and growth crisis in the next decade, it includes China, Canada, Australia, France and South Korea.
If France does suffer a significant credit crisis, which will completely derail the Macron presidency, it would have very significant implications for the political situation both inside France and in the EU.