In the recent article ‘Stormy weather ahead’ I explained some of the reasons why the global economy is slowing down, and how (unlike 2008) the slowdown is truly global and that this time it encompasses the emerging economies, including most significantly China. Signs of financial and economic distress are increasing and spreading. In this article I want to examine two indicators of the global slowdown: the slowdown in global trade trade and the contraction in global investment banking activity and revenues.
The contraction and distress in banking system is particularly dangerous as large parts of the global financial system are still in a weakened state from the 2008 crisis, and in the eurozone the deadly feedback loop between sovereign debt and the banks is still in place. The gigantic credit bubble in China has also left its banking system riddled with massive bad debt.
World Trade
The Merchandise World Trade Monitor by the CPB Netherlands Bureau for Economic Policy Analysis, a division of the Ministry of Economic Affairs, tracks global imports and exports in two measures: by volume and by unit price in US dollars. And the just released data for January shows just how much world trade has slowed in the last couple of years.
The World Trade Monitor for January, as measured in seasonally adjusted volume, declined 0.4% from December and was up a measly 1.1% from January a year ago. While the sub-index for import volumes rose 3% from a year ago, export volumes fell 0.7%. This sort of “growth,” languishing between slightly negative and slightly positive has been the rule last year.
The report added this about trade momentum:
“Regional outcomes were mixed. Both import and export momentum became more negative in the United States. Both became more positive in the Euro Area. Import momentum in emerging Asia rose further, whereas export momentum in emerging Asia has been negative for four consecutive months.”
This is also what the world’s largest container carrier, Maersk Lines, and others forecast for 2016: a growth rate of about zero to 1% in terms of volume. So the global economy is not exactly booming. But actually things are worse than just stagnation. In terms of prices per unit expressed in US dollars, world trade dropped 3.8% in January from December and is down 12.1% from January a year ago, continuing a steep decline that started in June 2014. Not that the index was all that strong at the time, after having cascaded slowly lower from its peak in May 2011.
If June 2014 sounds familiar as a recent high point, it’s because a lot of indices of global economic activity started heading south after that, including the price of oil, revenues of S&P 500 companies, total business revenues in the US. It was also when the US Fed was in the middle of tapering Quantitative Easing out of existence and as a result the dollar began to strengthen against other key currencies. Shortly after that, inventories of all kinds in the US began to bloat, a sign that trade and business activity was beginning to slow down.
Starting from June 2014, the unit price index of world trade has plunged 23%. It’s now lower than it had been at the trough of the Financial Crisis. It has hit the lowest level since March 2006.
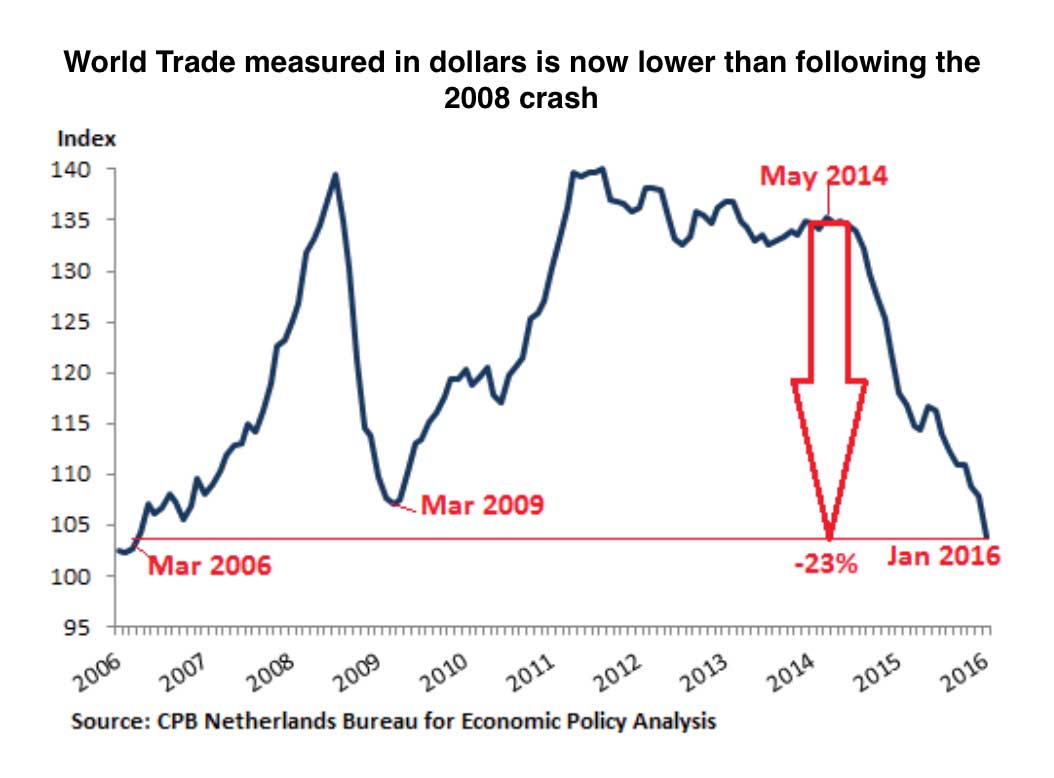
This chart puts in perspective what Nils Andersen, the CEO of Danish shipping-to-oil conglomerate AP Møller-Maersk, which owns Maersk Lines, had said last month in an interview following the company’s dreary earnings report and guidance: “It is worse than in 2008.”
But why the difference between the stagnation scenario in world trade in terms of volume and the total collapse of the index that measures world trade in unit prices in US dollars?
The volume measure is a reflection of a languishing global economy. It says that global trade may be sick, but it’s not collapsing. The problems resulting from the crash of 2008 and the Great Recession that followed have not gone away and the global economy appears to be once again entering a period of stagnation, and this time the emerging economies that helped sustain economic growth after 2008 are also slowing down.
The dramatic decline in world trade measured in US dollars is a reflection of two forces, occurring simultaneously: the collapsed prices of the commodities complex, ranging from oil to corn; and the strength of the US dollar, or rather the weakness of certain other currencies, particularly the euro. The other great factor is the depreciation of the Chinese yuan against the dollar. So exports and imports from and to China, measured in dollars, have crashed further than when measured in yuan.
And these currency and commodity price shifts came at a time of lacklustre global demand despite, or because of, seven years of QE, zero-interest-rate policies, and now negative-interest-rate policies. Depending solely on monetary measures to manage the global economy (as opposed to fiscal spending and state sponsored investment programs) has reached its limits and has caused new problems to emerge.The central bank monetary policies, such as QE, have failed to sufficiently stimulate demand though they have succeeded wonderfully in pushing up asset prices, and encouraging malinvestment, and overcapacity.
Global investment banking is suffering a severe contraction
World trade in goods is just one factor in the global economy. Now the global financial sector is getting hit too as the prolonged QE driven bonanza is bumping into real-world limits. And for global investment banking revenues, a key income source for “systemically important” banks, it has been one heck of a terrible first quarter.
Central-bank-imposed low interest rates and negative interest rates are killing bank earnings just as the collapsing energy prices have clobbered oil-and-gas loan related earnings. But it’s tough for banking all around, as the global QE bonanza is bumping into real-world limits. Maybe the Big Unwind has started.
Global investment banking revenues plunged 36% in the first quarter from a year ago to $12.8 billion. Fees across all products plunged, but the biggest cliff dive was reserved for fees from the Equity Capital Markets (ECM). Global ECM fees plunged a staggering 55% year-over-year to $2.3 billion, the lowest quarterly total since Q1 2009. That percentage cliff dive nearly matched the worst ever Q1 dive of 57% in 2001 when ECM fees plunged from $6.5 billion in Q1 2000 to $2.8 billion in Q1 2001, after the collapse of the dotcom bubble. Of those $2.3 billion in ECM fees, global IPO (Initial Public Offering) revenue accounted for $336 million, from 151 deals, the lowest quarterly total since Q1 2009, as IPO volume plummeted 74% to just $10.6 billion!
In the Debt Capital Markets (DCM), a similar scenario played out, but not quite as brutal. Global DCM revenues in Q1 plunged 32% year-over-year to $4.1 billion, the lowest since Q1 2009. Fees from junk bonds plummeted 70% and at a puny $522 million globally, these fees marked the worst first quarter since 2009. Fees from investment-grade bonds dropped 13% to $2.5 billion, propped up by the Anheuser-Busch InBev merger that generated $46 billion in bond issuance, the second largest investment-grade deal ever. Fees from syndicated lending plunged 30% to $1.9 billion, the third year in a row of Q1 year-over-year declines. Investment-grade loan fees plunged 50% to just $378 million.
Fees from corporate takeovers (‘Strategic M&A’ as it’s called) dropped 24% to $3.0 billion, the lowest Q1 total since 2010. Fees from private-equity led takeovers dropped 24% to $1.4 billion. Fees from private equity related investment banking plunged 46% to $1.8 billion, the worst first quarter since 2009, and accounted for only 14% of global investment banking revenues, the lowest Q1 share since 2009. This is a sign that private equity firms have lost their appetite for leveraged buyouts.
US investment banking fees in the first quarter plunged 38% to $6.0 billion (about half of the global total), matching Q1 2010. All US investment products were down. US Equity Capital Markets fees plunged 64% to $848 million. Fees from IPOs plummeted 77% to $76 million, with only eight smallish deals, the lowest Q1 fees and number of deals since 2009. M&A fees fell 28% year-over-year to $2.3 billion. In Q4, with M&A still grinding higher while other measures were declining, it accounted for 47% of total investment banking fees, an all-time record for any quarter. In Q1, the share of M&A fees was down to a still high 39% of total investment banking fees. DCM fees plunged 41% year-over-year to $1.6 billion, the worst Q1 since 2009. Fees from junk debt plummeted 67% to $300 million, the lowest Q1 since 2009, as volume plummeted 71%. Fees from investment grade debt also got hammered but not quite as brutally, falling 29% to $950 million.
Total investment banking revenues in Europe, Middle East, and Africa (EMEA) in the first quarter plunged to $3.5 billion, the lowest since 2002! In the Asia-Pacific region, investment banking fees dropped to $2.5 billion, the lowest since Q1 2009.
But in China, whose credit bubble is getting blown to stunning proportion in order to keep the collapsing credit bubble from collapsing, investment banking fees rose 5% in Q1 to $1.4 billion, the only nation of the top five globally to increase fee revenue. Of that total, DCM fees soared 79% to $615 million, the highest first quarter on record – as debt issuance is ballooning.
Barring a financial crisis, it is hard to imagine a worse quarter for the big banks engaged in investment banking. And yet, it’s just the beginning. Banks have been at the epicentre of the great global credit bubble. They’ve benefited from it. They’ve sucked it dry. They’ve become bigger and fatter and paid out record bonuses for years. But now the Great Unwind may have arrived. What we may be witnessing is the great finance capital global boom finally coming to an end. If so the result will be a prolonged period of painful deleveraging, stagnation, contraction and financial instability.

A well researched piece. Just what I was looking . Great job
Comments on this entry are closed.