One diagram that explains the 2017 UK election result
16/09/2017
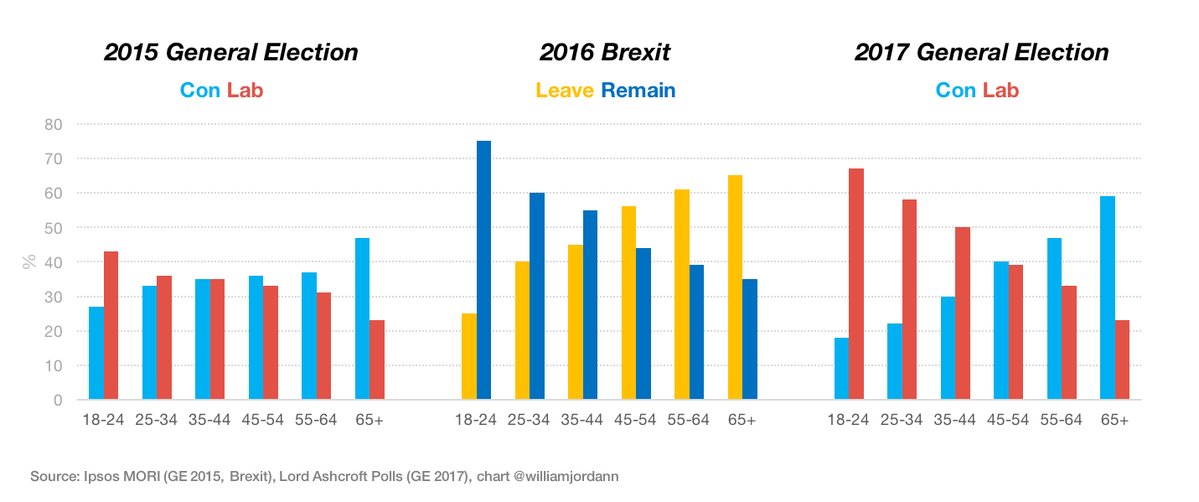
These three graphs make a convincing statement about how the Brexit vote changed UK politcs. Comparing the two election results it is clear that the breakdown of the 2017 results by age was an almost exact clone of a similar breakdown of the referendum result. Basically younger voters voted Remain and switched to Labour, and older voters voted Leave and switched to the Tories.