
Global capital flows played an important part in the destabilisation of the financial system prior to the crisis of 2008. Working out what capital flows are occurring in the world economy, how much capital is flowing, where capital is coming from and going to, is made difficult because a significant proportion of the capital being moved is the result of illicit activity and its sources and destinations are deliberately hidden. Every year, roughly $1 trillion flows illegally out of developing and emerging economies due to crime, corruption, and tax evasion. This amount is more than these countries receive in foreign direct investment and foreign aid combined.
At the beginning of December 2015 a new report was released that highlights the latest data available on this “hot” money. Assembled by Global Financial Integrity, a research and advisory organisation based in Washington, DC, the report details illicit financial flows of money from developing countries using the latest information available, which is up until the end of 2013.
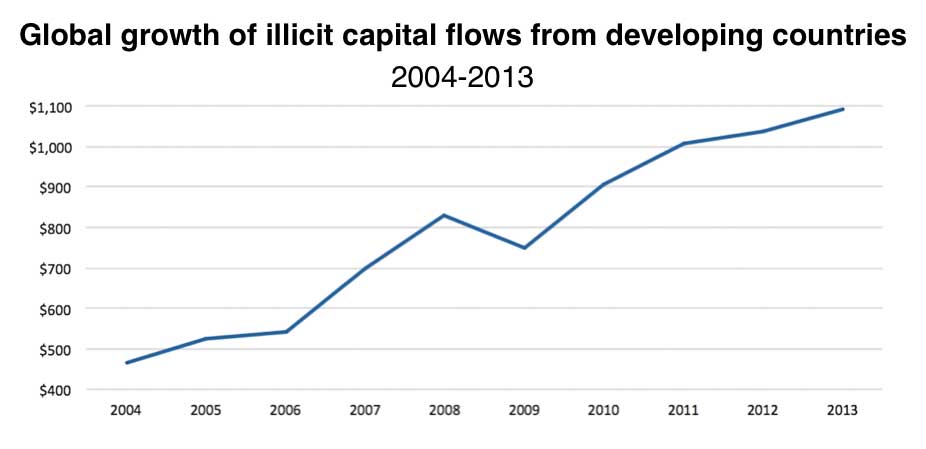
The cumulative amount of this “hot money” coming out of developing countries totalled just over $7.8 trillion between 2004 and 2013. On an annual basis, it breached the $1 trillion mark each of the last three years of data available, which means illegal capital flows are growing rapidly at an average rate of 6.5% rate annually.
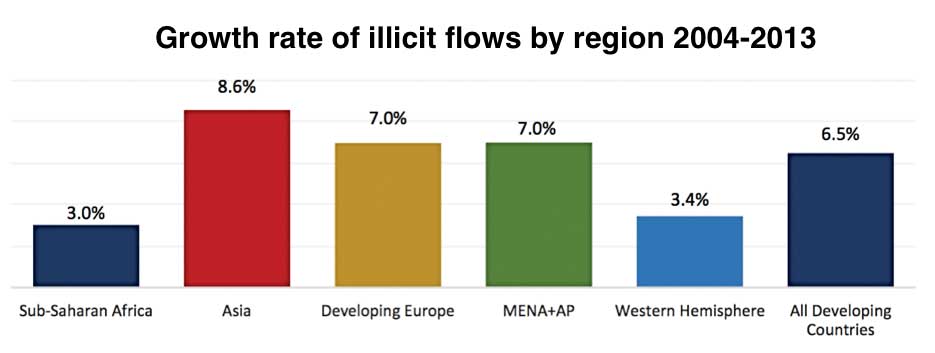
In Asia, illicit financial outflows are growing even quicker at an 8.6% clip. It’s also on that continent that five of the ten largest source economies for these flows can be found, including the largest offender, which is China. The Chinese restructuring (see this article and this one) involves the dismantling of parts of the corrupt state apparatus that is the source of the wealth of a large part of the Chinese elite, and in the last few years the flow of capital leaving China has accelerated sharply and this includes a significant proportion of illicit funds as the wealthy members of the party elite attempt to hide, and securely store, their wealth.
How does this “hot” money leave these countries? Global Financial Integrity has calculated that 83% of illicit financial flows are due to what it calls “trade misinvoicing”.
It’s defined in the Global Financial Integrity report as the following:
“The misinvoicing of trade is accomplished by misstating the value or volume of an export or import on a customs invoice. Trade misinvoicing is a form of trade-based money laundering made possible by the fact that trading partners write their own trade documents, or arrange to have the documents prepared in a third country (typically a tax haven), a method known as re-invoicing. Fraudulent manipulation of the price, quantity, or quality of a good or service on an invoice allows criminals, corrupt government officials, and commercial tax evaders to shift vast amounts of money across international borders quickly, easily, and nearly always undetected.”
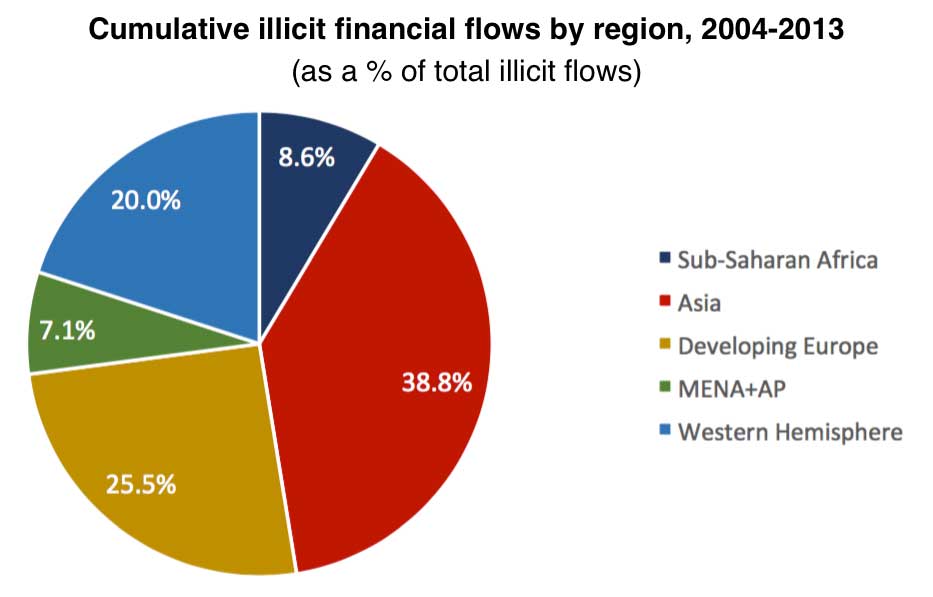
This report also divides the data on illicit financial out flows from the developing world during the period 2004-2013 into five major geographical regions: Sub-Saharan Africa, Asia, Developing Europe, MENA+AP (Middle East, North Africa, Afghanistan, and Pakistan), and the Western Hemisphere.
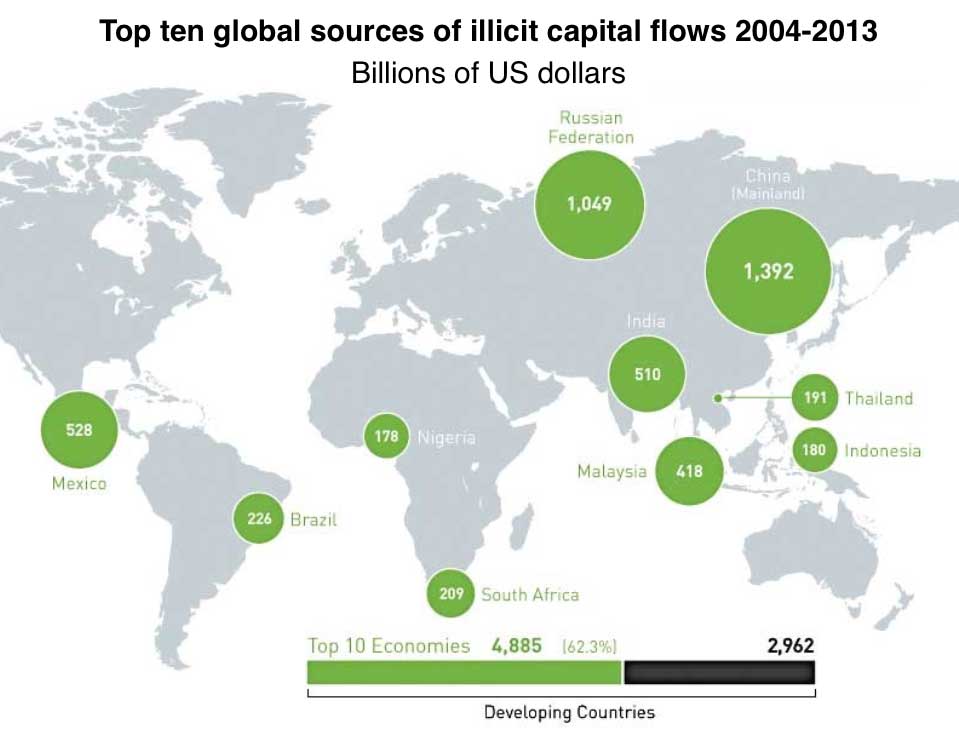
Sub-Saharan Africa accounted for 8.6 percent of cumulative illicit financial flows. There are two Sub-Saharan African countries in the top ten globally: South Africa (7th) and Nigeria (10th). Illicit financial flows averaged a sizeable 6.1 percent of the region’s GDP over this ten-year period.
Asia accounted for 38.8 percent of cumulative illicit financial flows. There are five Asian countries in the global top ten: China (1st), India (4th), Malaysia (5th), Thailand (8th), and Indonesia (9th). Illicit financial flows averaged 3.8 percent of the region’s GDP over this ten-year period.
What the report termed ‘Developing Europe’ accounted for 25.5 percent of cumulative illicit financial flows. Russia (2nd) is the only country in this region to appear in the global top ten. Illicit financial flows averaged 5.9 percent of the region’s GDP over this ten- year period.
MENA+AP accounted for 7.1 percent of cumulative illicit financial flows. There are no MENA+AP countries in the global top ten; Iraq is the highest at 16th. Illicit financial flows averaged 2.3 percent of the region’s GDP over this ten- year period.
The Western Hemisphere accounted for 20.0 percent of cumulative illicit financial flows. There are two Western Hemisphere countries in the global top ten: Mexico (3rd) and Brazil (6th). Illicit financial flows averaged 3.6 percent of the region’s GDP over this ten-year period.